Measuring Page Transitions with Scripts
Capturing page load performance for a specific URL is a great start to detect opportunities to improve performance, but some performance testing requires user interaction to facilitate, such as page load following a successful login or submission of a form. The Sauce Labs custom WebDriver command allows you to trigger performance capturing within an automation script at a precise point of interaction, ensuring you can isolate any issues related to the current app state.
Using automation to test performance after targeted interaction with your app in no way implies that you should integrate performance testing in your existing functional test suite. Testing function and performance in the same test is likely to result in compromised results for both objectives and can obscure failure troubleshooting.
What You'll Learn
- How to enable performance in your automation script
- How to measure performance as the automation runs
- How to detect regressions
- How to write the performance results to a log
- How to view your results
What You'll Need
- A Sauce Labs account (Log in or sign up for a free trial license).
- Your Sauce Labs Username and Access Key.
- Have your SAUCE_USERNAME and SAUCE_ACCESS_KEY defined for your environment.
- Google Chrome (no older than 3 versions from latest) as the test browser.
- An automation script that performs the interaction with your app during which you want to measure performance.
Performance testing is not compatible with WebDriver BiDi at this time. If you are using Selenium, avoid setting
webSocketUrl: true in your capabilities. For recent versions of WebdriverIO, you must force WebDriver Classic by
setting 'wdio:enforceWebDriverClassic': true in your top-level capabilities.
Setting Performance Capabilities
Before you configure your script to capture performance metrics as it executes, you must update your capabilities
configuration file to enable performance actions. To do this, set the extendedDebugging and capturePerformance
sauce:options attributes to True. The following excerpts show you the Webdriver.io sauce:options code samples
for a variety of supported languages.
- Python
- JavaScript
- Ruby
def driver(request):
    sauceOptions = {
        "screenResolution": "1280x768",
        'name': 'Pytest Chrome Performance Sample',
        'extendedDebugging': 'true',
        'capturePerformance': 'true'
    }
    chromeOpts =  {
        'platformName':"Windows 11",
        'browserName': "chrome",
        'browserVersion': '145.0',
        'sauce:options': sauceOptions
    }
const { config } = require('./wdio.shared.conf')
const defaultBrowserSauceOptions = {
  build: `WebdriverIO Front-End Performance-${new Date().getTime()}`,
  name: `WebdriverIO Front-End Performance-${new Date().getTime()}`,
  extendedDebugging: true,
  capturePerformance: true
}
browser_name = ENV['BROWSER_NAME'] || 'chrome'

options = {browser_name: browser_name,
           platform_name: ENV['PLATFORM_NAME'] || 'Windows 11',
           browser_version: ENV['BROWSER_VERSION'] || 'latest',
           'sauce:options': {name: "#{scenario.feature.name} - #{scenario.name}",
                             build: build_name,
                             username: ENV['SAUCE_USERNAME'],
                             access_key: ENV['SAUCE_ACCESS_KEY'],
                             extended_debugging: true,
                             capture_performance: true }}
Implementing the Performance Command Assertion
The custom sauce:performance command measures the performance output against
a baseline of previously accepted performance values. If no baseline has been
set, the Performance test will create one by measuring performance output 10
times to get an aggregate baseline. The command returns pass when the current
results are within the baseline allowances or fail when the results fall
outside the baseline. A fail result gives you the option to handle
regressions.
Enabling performance capturing can add up to 60 seconds per URL change in a test. We, therefore, advise separating your performance tests from your functional tests. See our Performance Requirements and Recommendations for more advice on optimizing your performance test results.
Command
sauce:performance
Arguments
| Argument | Description |
|---|---|
nameRequired | A name of the test as it would appear on Sauce Labs. |
metricsOptional | Specifies one or more specific metrics you want to assert. If not specified, the test defaults to score, which automatically tests all metrics that currently make up a Lighthouse Performance Score. See Metric Values for the list of supported metric values. |
Script Examples
The following samples are excerpts that show the sauce:performance assertion used in a Selenium test script.
- Python
- JavaScript
loading...
describe('Sauce Labs Front-End Performance', () => {
  beforeEach(() => {
    // Adding extra logs to the Sauce Commands Dashboard
    browser.execute('sauce:context=########## Start beforeEach ##########')
    // Now load the url and wait for it to be displayed
    browser.url('')
    // Adding extra logs to the Sauce Commands Dashboard
    browser.execute('sauce:context=########## End beforeEach ##########')
  })

  afterEach(() => {
    // Adding extra logs to the Sauce Commands Dashboard
    browser.execute('sauce:context=########## Enf of test ##########')
  })

  it('logs (sauce:performance) should check if all metrics were captured', () => {
    // The expected metrics
    const metrics = [
    'load',
    'speedIndex',
    'firstInteractive',
    'firstVisualChange',
    'lastVisualChange',
    'firstMeaningfulPaint',
    'firstCPUIdle',
    'timeToFirstByte',
    'firstPaint',
    'estimatedInputLatency',
    'firstContentfulPaint',
    'totalBlockingTime',
    'score',
    'domContentLoaded',
    'cumulativeLayoutShift',
    'serverResponseTime',
    'largestContentfulPaint'
    ]
    // Get the performance logs
    const performance = browser.execute('sauce:log', { type: 'sauce:performance' })
    // Verify that all logs have been captured
    metrics.forEach((metric) =>
    expect(metric in performance, `${metric} metric is missing`))
  })

  it('(sauce:performance) should validate speedIndex', () => {
    // Get the performance logs
    const performance = browser.execute('sauce:log', { type: 'sauce:performance' })
    // Verify that all logs have been captured
    expect(performance.speedIndex < 1000, `${performance.speedIndex} is equal or bigger than 100`)
  })
})
Target Specific URLs in a Script
You can use the sauce:performanceDisable and sauce:performanceEnable commands to limit the collection of
performance metrics to specific URL pages. Implementing these pauses in metrics collection allows you to bypass
navigational pages such as login so your tests are faster and more efficient, and your performance results are more
relevant.
Example
browser.execute('sauce:performanceDisable')
browser.url('https://www.json.org/json-en.html')
browser.execute('sauce:performanceEnable')
browser.url('https://example.com')
In the preceding example, performance metrics will only be collected for https://example.com.
Defining a Performance Budget
Rather than letting a baseline determine the acceptable metric values for your pages, you can define your own metric value limits for individual pages in your app and then assert against those values to ensure your performance results are always within the range that your deem optimal.
First, create a separate file in which you define your target metric limits, as in the following example.
{
  "https://saucelabs.com/": {
    "speedIndex": 2300,
    "lastVisualChange": 2200,
    "load": 4200
  },
  "https://saucelabs.com/platform/analytics-performance/sauce-performance": {
    "score": 0.78
  }
}
Then, import your budget file in your test script and assert your performance call against the values in your budget, as shown in the following sample.
const budgets = require('./budget.json')

for (const [url, budget] of Object.entries(budgets)) {
  await browser.url(url)
  const performanceLogs = await browser.execute('sauce:log', {type: 'sauce:performance'})

  for (const [metric, value] of Object.keys(budget)) {
    assert.ok(performanceLogs[metric] < value`metric ${metric} is over the performance budget`)
  }
}
Handling Regressions
When one or more metric evaluations fail because the result falls outside the established baseline, it is considered a regression and the tester has an option to either troubleshoot and resolve the source of the regression to get the test back into the baseline range or update the baseline with the new performance values. If new baselines are accepted, the command will measure performance against those new values until another regression is detected, when you will again have the option to troubleshoot or update the baselines.
Since the command can be called throughout the test script, create tests that check for performance regressions across core business flows and screens. For example, evaluate pages that load following a successful login event or require multiple steps to trigger.
sauce:performance is only aware of the performance metrics of the get URL command that was called before it and not
able to capture metrics for views that were navigated via webdriver actions (e.g button clicks). In this example,
the custom command returns performance metrics for the /inventory.html URL.
describe('Performance Demo Test', function () {
    const { title } = this;

    it('Asserts for regressions on the inventory page', () => {
        // log into the app
        browser.url('https://www.saucedemo.com');
        const username = $('[data-test="username"]');
        username.setValue('standard_user');
        const password = $('[data-test="password"]');
        password.setValue('secret_sauce');
        const loginButton = $('.login-button');
        loginButton.click();
        browser.url('/inventory.html');
        // assert performance of pageLoad has not regressed.
        const performanceOutput = browser.execute('sauce:performance', {
        name: title,
        metrics: ['load'] });
        assert.equal(performanceOutput.result, 'pass', performanceOutput.reason);
    });
});
Sample Response
The following response is returned when the Page Load metric is above the expected baseline.
"reason": "Metrics [load] are significantly out of the baseline",
"result": "fail",
"details": {
 "load": {
   "actual": 12178,
   "lowerLimit": 813.6839391929948,
   "upperLimit": 2910.759098781689
 }
}
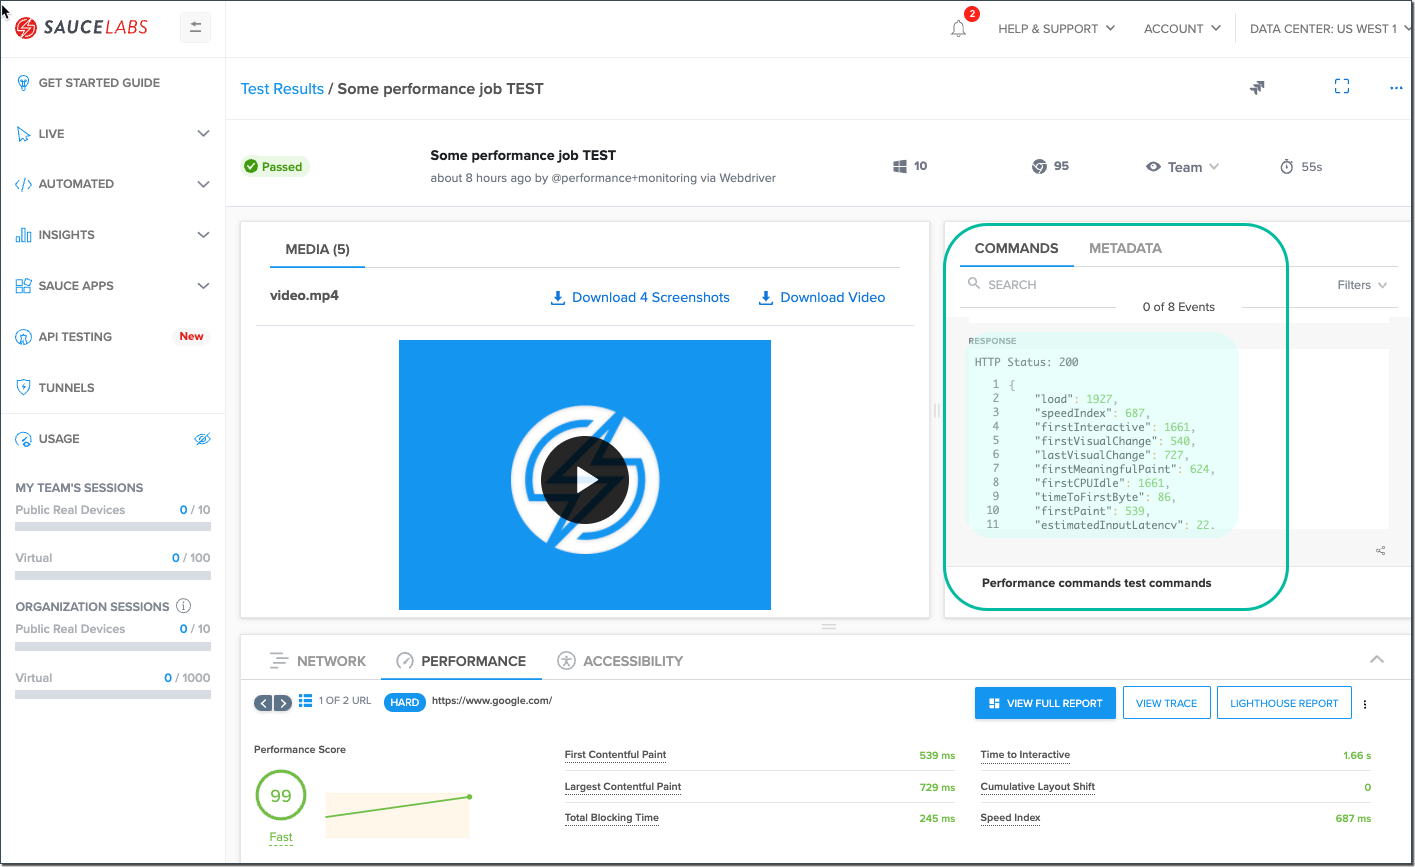
Logging Performance Results
You can also send your performance results to the log that is viewable from the Sauce Labs test result page.
To enable this, configure sauce:performance within the sauce:log command. Set the fullReport option to true
in the configuration to capture extended details about the performance configuration, aside from just the metrics output.
- Python
- JavaScript
def test_speed_index(self, driver):
    self.setUpClass(driver)
    metrics = ["load", "speedIndex", "pageWeight", "pageWeightEncoded", "timeToFirstByte",
               "timeToFirstInteractive", "firstContentfulPaint", "perceptualSpeedIndex", "domContentLoaded"]
    performance = driver.execute_script("sauce:log", {"type": "sauce:performance", options: {fullReport: true}})
    for metric in metrics:
        assert performance["speedIndex"] < 1000
// Get the performance logs
const performance = browser.execute('sauce:log', {
  type: 'sauce:performance',
  options: { fullReport: true }
})
In addition to reviewing the log in Sauce Labs, you can retrieve the log locally by calling:
driver.execute('sauce:log', {type: 'sauce:performance'});
See Using Extended Debugging for additional network and logging options enabled with extended debugging.