Platform Overview
This document provides a brief overview of the Backtrace Debugging Platform and its components. If you want to start integrating the platform, refer to the "Getting Started" menu.
Backtrace is a post-mortem crash debugging platform that helps you triage and fix bugs more effectively in applications and operating systems. When your application fails, Backtrace takes a snapshot of the faulting component and surrounding environment at high speeds, analyzes it, and archives it in a centralized object store.
At a high level, the Backtrace platform includes:
- An incredibly fast and extensible snapshot generator that captures critical data on demand, even at the time of the fault.
- A set of analysis modules that extract and highlight anomalous behavior such as stack overflow, null deference, heap mismanagement issues, and more.
- An object store that aggregates and facilitates collaboration on captured data across your environments.
- Workflow integrations that integrate the rich dataset captured into workflow tools like Slack and JIRA.
- Web and Terminal interfaces to visualize and analyze the captured data.
Below is the architectural diagram of the Backtrace Platform:
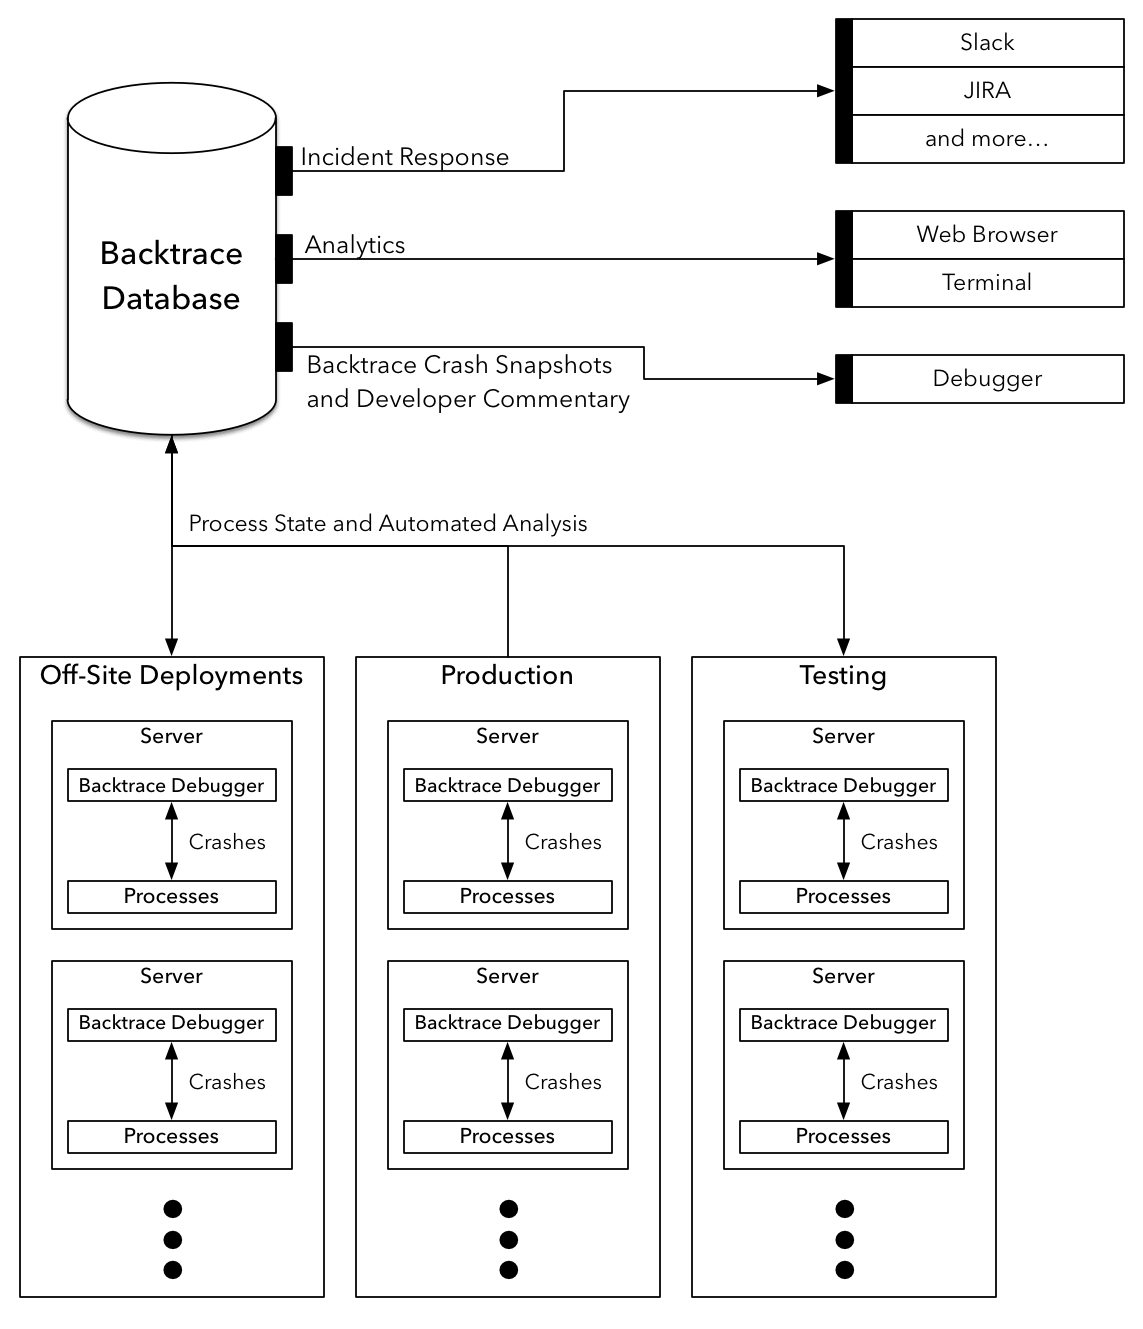
These components come together to provide a system that allows teams to easily track, prioritize, and act on incidents as they occur. Backtrace supports software whether it's provided as a service, shrink-wrapped and shipped, or bundled with hardware as an appliance.
The following sections provide a deeper look into each of these components and how they work together.
Snapshot Generator
Backtrace's Snapshot Generator builds on top of our incredibly fast tracer to capture application state and the surrounding environments. The data is stored in a structured, self-contained format we call a snapshot. A snapshot contains:
- The stack trace across all threads.
- Regions of memory backing reachable objects on the stack and heap.
- Requested global variables.
- Environmental information such as virtual memory stats, CPU stats, process state, and more.
- Any contextual metadata you choose. This includes things like data center, customer, version, and environment. Our snapshot format doesn't impose any restrictions on your metadata.
- Annotations and classifiers added by analysis modules to highlight anomalous behavior. You can easily ship your own modules using our LUA or C API.
The Backtrace Snapshot Generator works across a variety of environments and targets. It can attach to live processes for on-demand snapshots or generate a snapshot from a user space or kernel coredump (kernel coredumps are only supported on FreeBSD). The Backtrace Snapshot Generator runs on Linux, FreeBSD, and OmniOS.
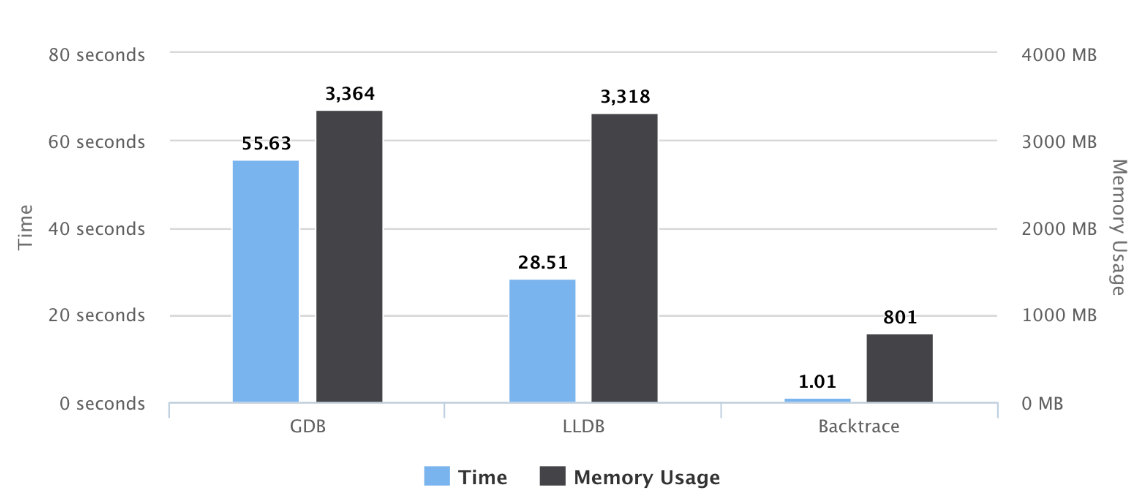
The chart below compares our snapshot generator to GDB and LLDB generating a stack trace from Chromium. During this test, GDB and LLDB are generating a stack trace, while the Backtrace Snapshot Generator is gathering all of the data listed above, performing automated analysis, and serializing this data to disk.
Analysis Modules
Backtrace's Snapshot Generator takes advantage of our fast core libraries to run automated analysis to assist in root-cause investigation. Our snapshot generator comes with a set of analysis modules to pinpoint the cause of the crash and, in some cases, identify peripheral bugs that can cause crashes in the future. For example, our snapshot generator will automatically disambiguate the direction of the fault, highlight aliases of the faulting operands across all threads, check function constraint violations in commonly used code like memcpy and realloc, and annotate common heap mismanagement issues for popular memory allocators like jemalloc and ptmalloc.
We expose the same LUA and C API our analysis modules use to all of our users. You can use this functionality to customize our snapshot generator for your software, incorporate common and expert debugging practices, and include application state crucial for incident response. Below are some example outputs from our analysis modules in the Hydra section below.
Object Store
Snapshots are sent to and aggregated in Backtrace's object store, also known as coroner. Coroner makes the wealth of information across your snapshots accessible with ease. You can issue queries to gain insights into the fault data across your entire system, such as which customers are being affected by certain types of faults, which versions are currently causing incidents, and even generate a histogram that shows how frequently certain functions appear in the faulted thread's stack trace.
Web UI
Console, our web-based user interface, provides a bird's-eye view of the data stored inside coroner.
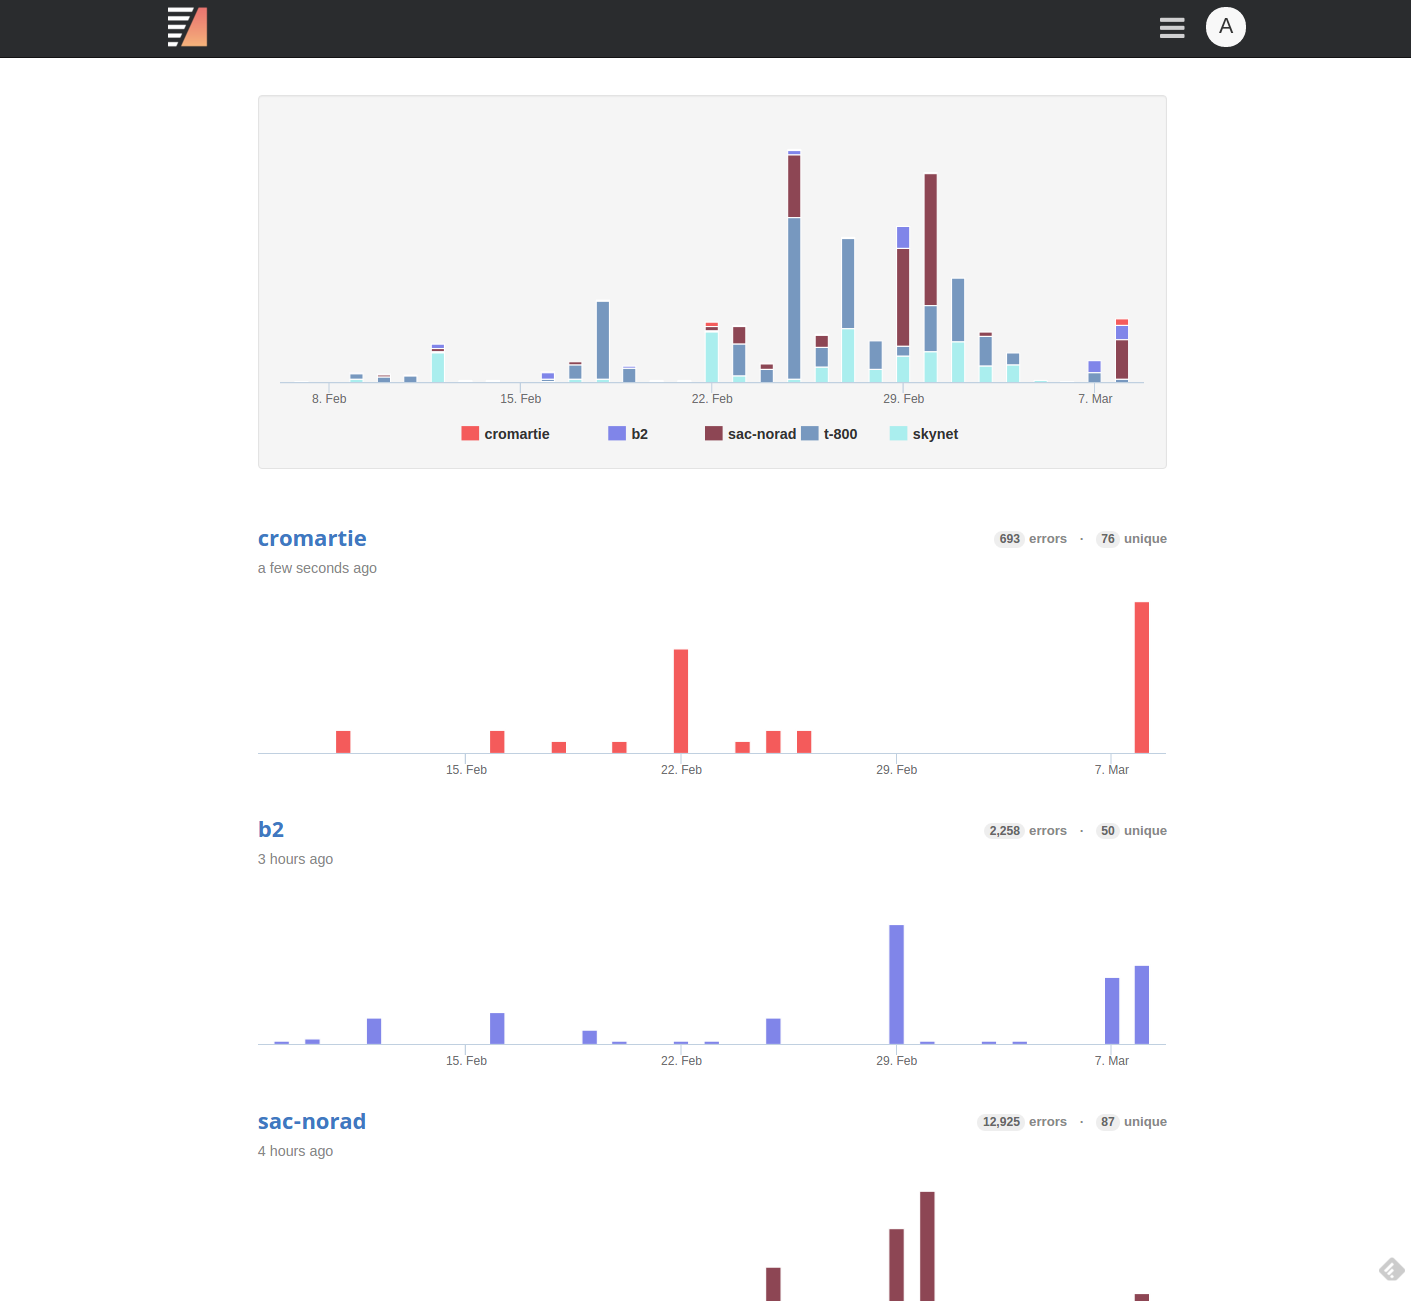
When you log in, you will see an activity summary across all of your software projects. You can click on each software project to inspect the different types of faults affecting it.
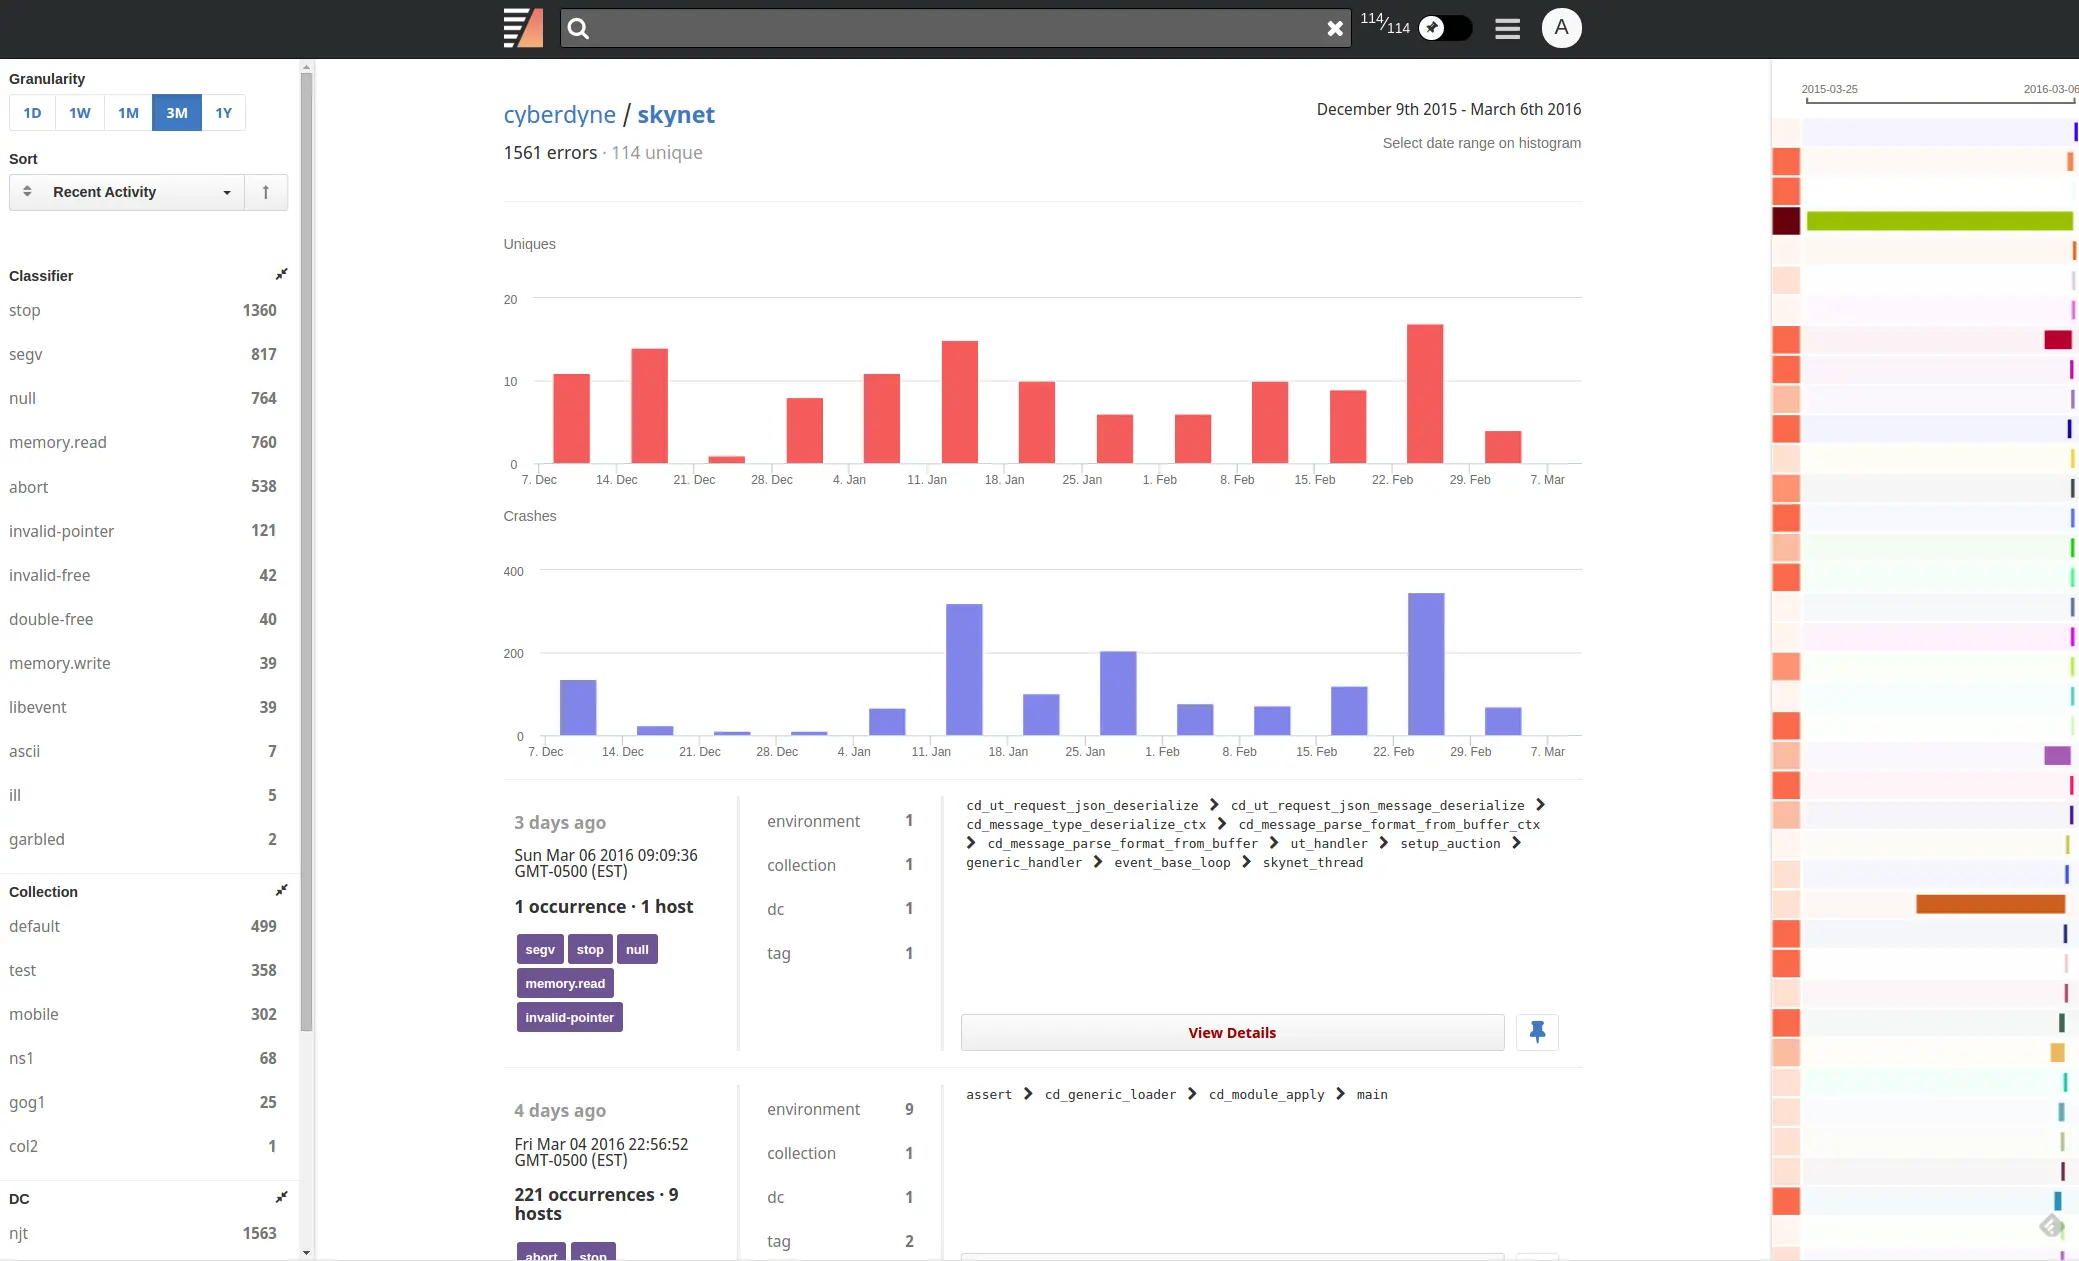
On the left, you find gathered metadata and automated analysis statistics, along with controls to define sorting order, filters, etc. On the right, you see the time range for each fault group, along with a color box indicating activity. Groups with darker colors have experienced more faults than those without.
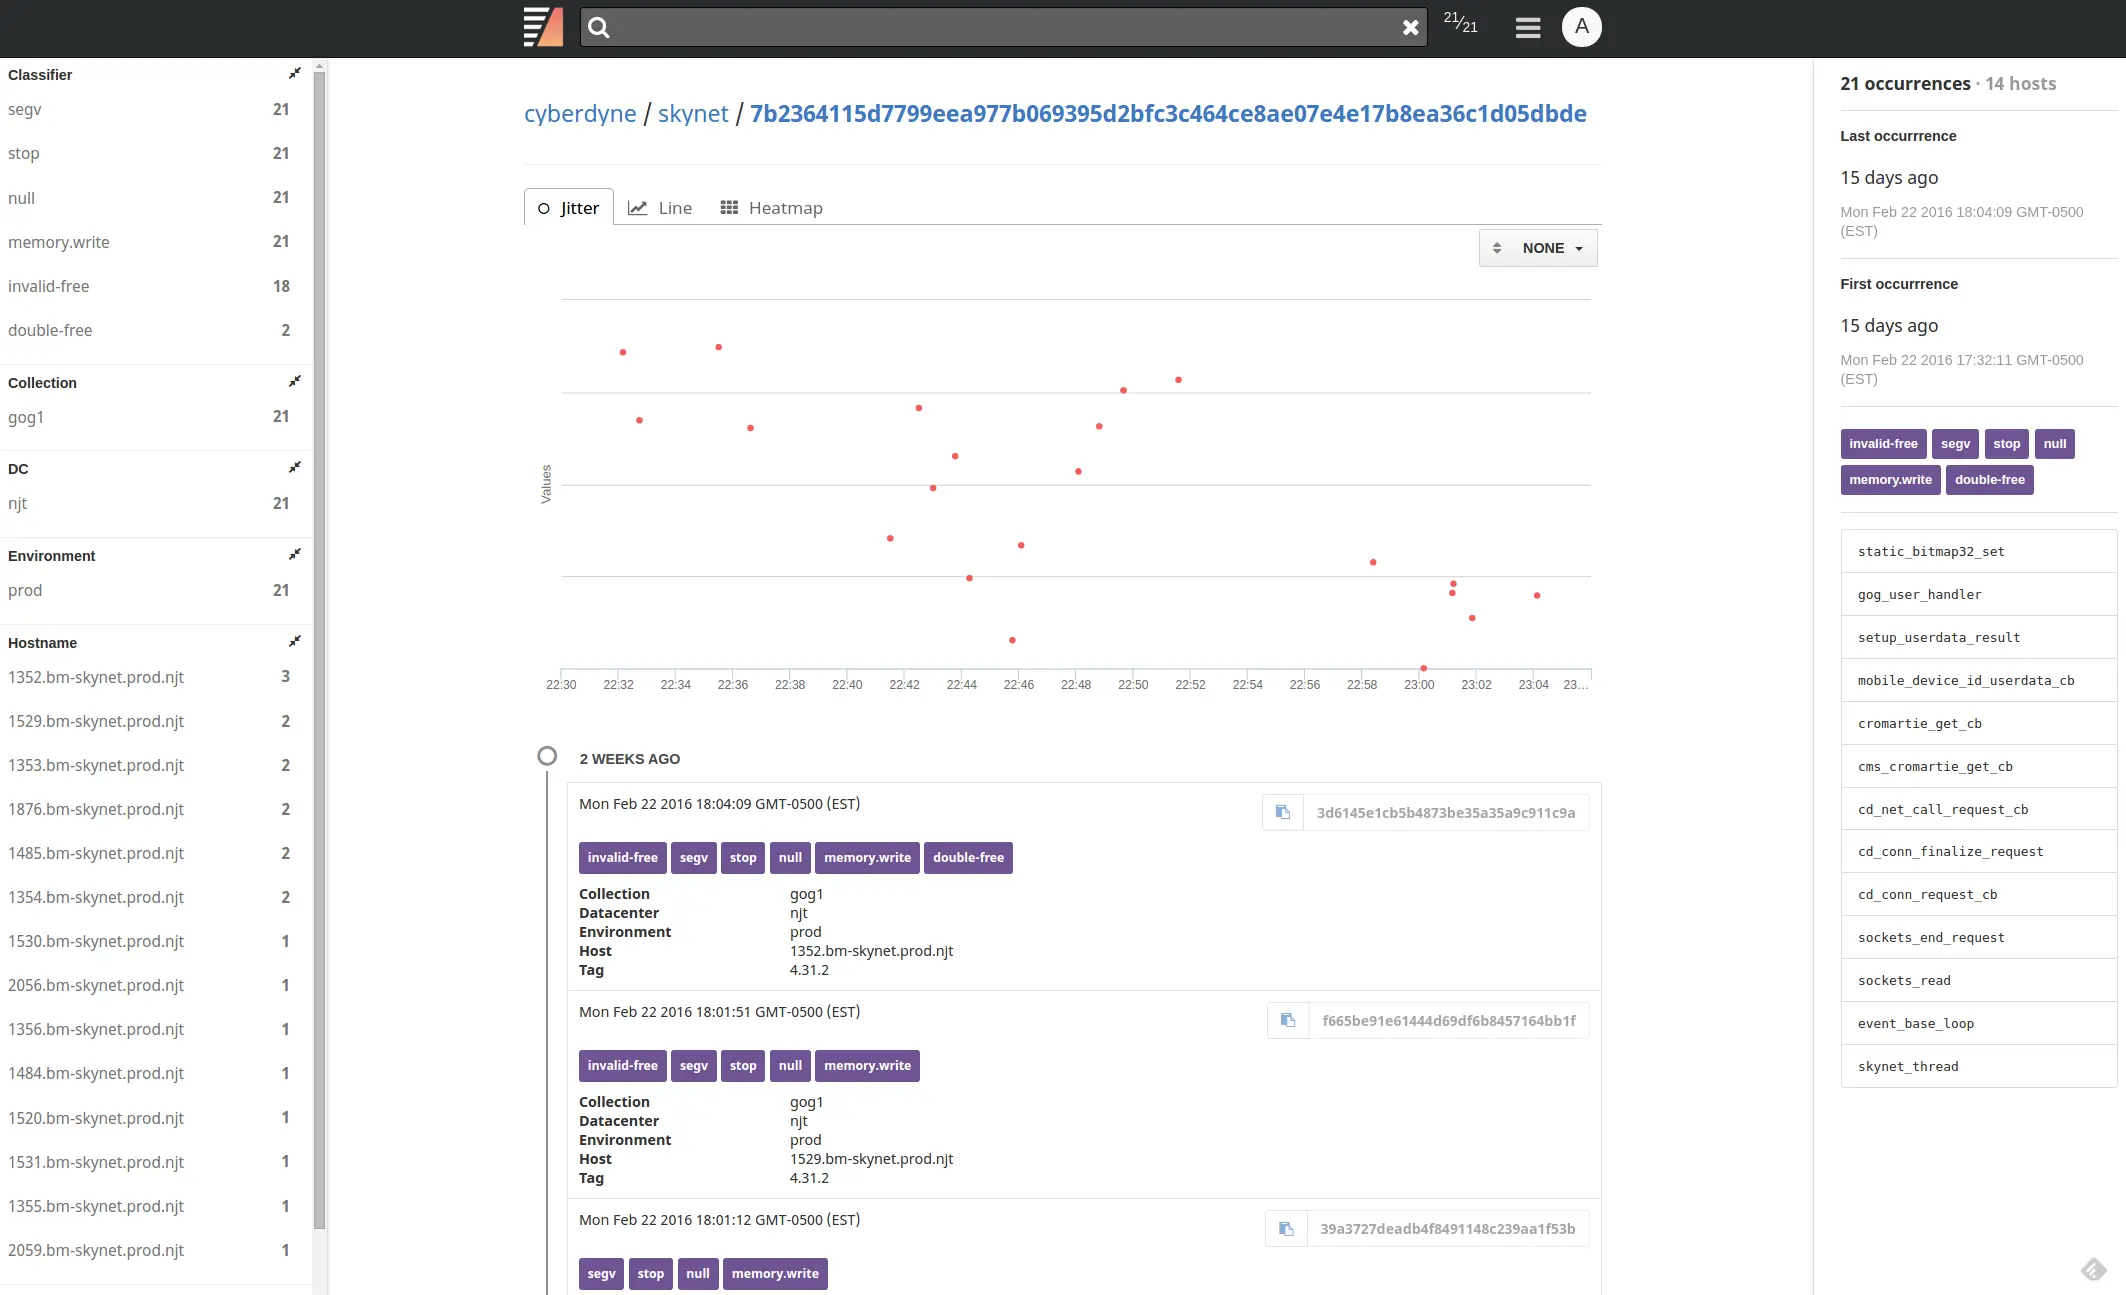
More detailed information about each group can be viewed by clicking on View Details. This page shows specific instances of the fault, with the option to graph these instances on a jitter plot, line graph (number of instances over time), or a time-based heat map.
The left pop-out menu shows metadata statistics associated with the group, and the right pop-out menu shows the first and last occurrence, added classifiers, and the faulted thread's stack trace (if available). Snapshot instances for each group are listed below the graph. You can notice a small icon on the right of each listing. Clicking on this icon, copy the command to download the corresponding snapshot.
Terminal UI
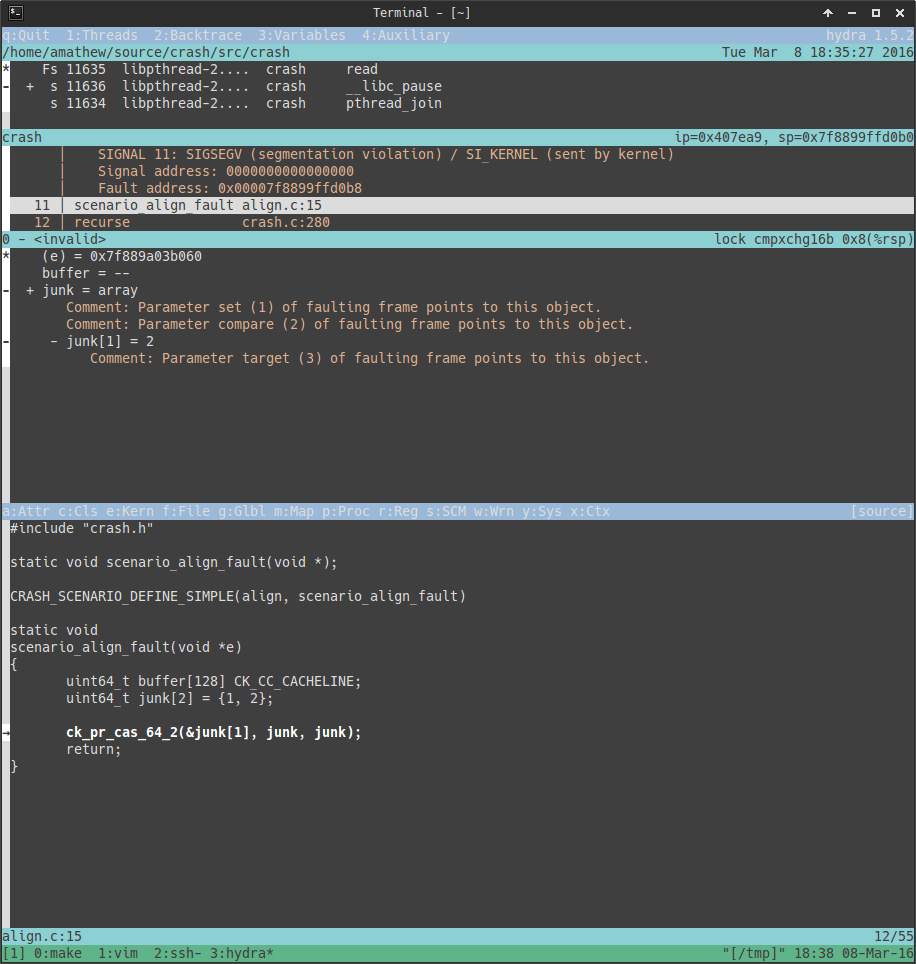
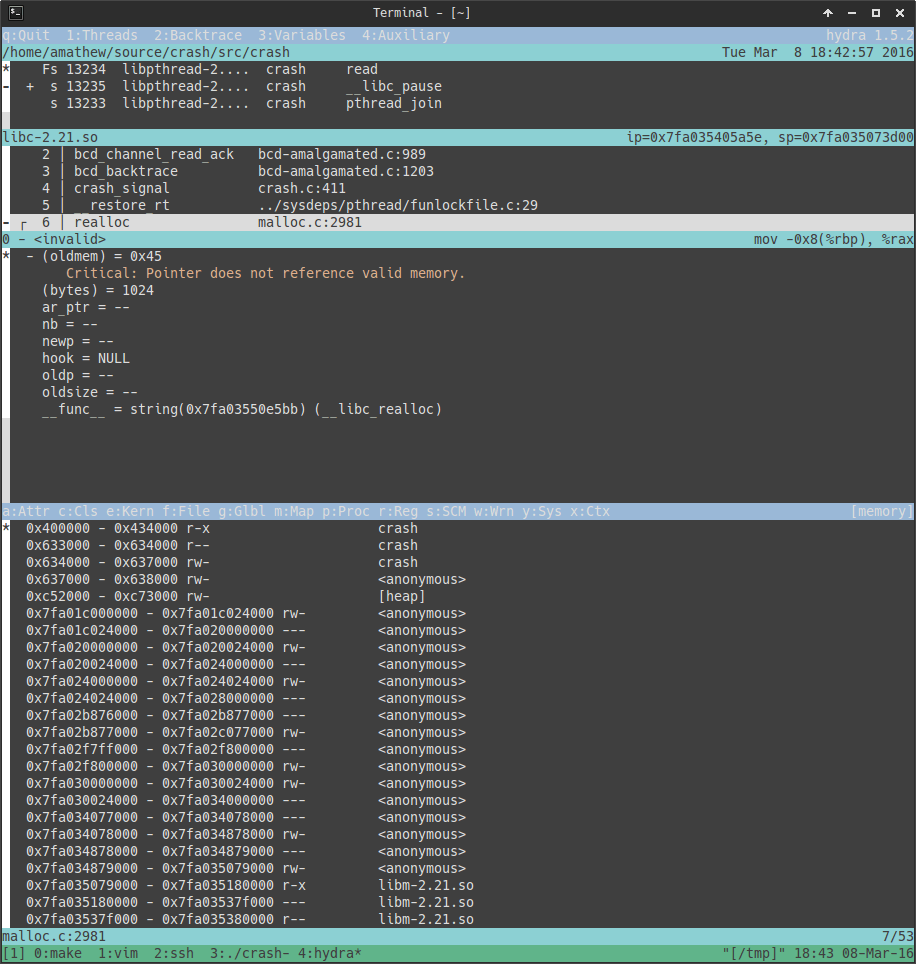
Backtrace's Hydra allows you to view the internals of each snapshot in a powerful yet approachable terminal UI.
The initial view of Hydra immediately focuses on the faulting context. Hydra's main outline includes four panes (from top to bottom):
- Thread pane: list of threads in the captured process.
- Stack pane: stack trace for the selected thread.
- Variable pane: variables for the selected frame.
- Peripheral pane: displays various information based on a menu, including metadata and classifiers associated with the snapshot, kernel stack trace associated with the selected thread (Linux only), process memory map, registers, source code with integration into your favorite SCM, annotations from our automated analysis, system statistics, and much more.
Below are some examples of what viewing a snapshot in Hydra looks like. You can find a more in-depth walkthrough of Hydra in the dedicated section.
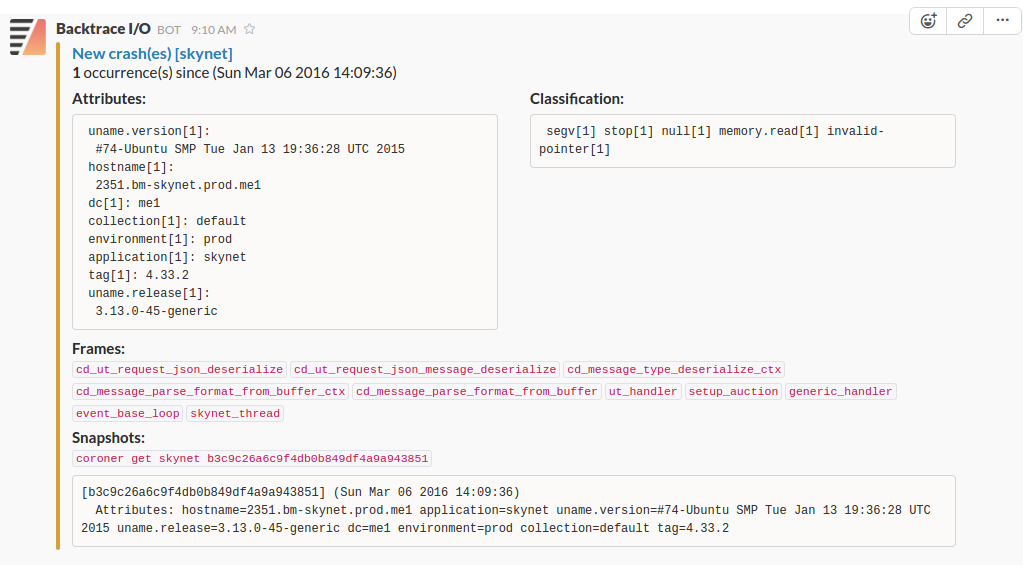
Workflow Integrations
Backtrace's Object Store integrates with your existing workflow tools such as Slack and JIRA. The rich dataset and automated analysis stored in the object store can be sent to these services every time a new fault or fault type is detected. Below is an example of our Slack integration:
Conclusion
Backtrace improves system availability and software quality by bringing automation to incident detection, response, and resolution. The Backtrace platform automatically snapshots faulting applications and their surrounding environments, then analyzes and archives them in a centralized object store. Our technology captures incidents in unprecedented detail and makes this data accessible, ensuring that bugs are not missed and are fixed faster.
If you have already signed up for a trial and received your license number, you can start by exploring our Getting Started menu. Otherwise, feel free to sign up for a trial on our website or reach out to us for more information.