Troubleshooting
What does the 000... fingerprint mean?
A report being grouped into the 000 fingerprint means that there’s either no faulting callstack, or the faulting callstack doesn’t have any module information (shows addresses only with no accompanying .exe or binary). This could be caused by the report being
- generated on a non-faulting process
- a custom json report without a thread marked as faulted
- a corrupt dump
- or having obfuscation issues
This can sometimes be fixed by
- using an error processing modifier to mark a thread as faulting
- correcting/adjusting report generation to include a faulting thread and module info
Can I Use Backtrace In Conjunction With Another Crash And Error Reporting Library?
For example, can I use Backtrace with Firebase Crashlytics?
Yes, it is possible to use Backtrace in conjunction with Firebase Crashlytics on Android and iOS. However, there are some limitations to keep in mind:
-
Only one native crash signal handler can be active per session. Generally, the last crash handler that was initialized is used, but there have been instances of non-deterministic behavior where both handlers are called, only the first initialized handler is called, or neither are called.
-
It is possible to disable the native functionality in Backtrace while keeping other features enabled, such as Crash Free metrics, Breadcrumbs, and Exception reporting. Refer to the SDK documentation for instructions on how to do this. A similar approach may be possible with the other crash reporting library as well.
Unhosted Symbols
In some cases, third-party platforms may offer debugging symbols as a direct download. Since these symbols are not available on a public symbol server, they are not included in our defaults. Here are a few known cases:
- Renaming of a third-party library like Electron. For example, you can find Electron's releases at this GitHub repository: https://github.com/electron/electron/releases.
- Debug symbol packages for your preferred Linux distribution. You can find more information in the Ubuntu Wiki.
The following example focuses on an unsymbolicated Electron crash:
-
To locate the symbol filename and debug ID, you can hover over the missing symbol from a crash or check the project's missing symbols list. Both will provide you with the filename (for example, Electron Framework) and the debug ID (for example, 45E07FE79CAC31169A0459CA63D608A70).
-
If you are using a public Electron release, you can find their symbols at the GitHub repository. Navigate to the version of Electron you are using.
-
If you are unsure of the version in use, you can locate the version attribute of the given crash. Let's assume the attribute is
11.4.7.- For macOS, locating the matching symbol file can be a bit tricky. However, in this example, I found a match in
electron-v11.4.7-darwin-x64-symbols.zipspecifically in the folder\electron-v11.4.7-darwin-x64-symbols.zip\breakpad_symbols\Electron Framework\45E07FE79CAC31169A0459CA63D608A70.
- For macOS, locating the matching symbol file can be a bit tricky. However, in this example, I found a match in
-
After locating the symbol file, you may need to update the filename to match the debug console in your Backtrace project. In this case, you would rename the symbol with the debug ID
45E07FE79CAC31169A0459CA63D608A70toyourApplicationsName. -
To upload the symbol, it is best practice to add it to an active zip or tar archive. You can then use curl or the webUI to upload the archive containing the symbol(s). The following support documents provide guidance for both processes:
-
All crash data present in a project before uploading the symbols must be reprocessed to account for the newly added symbols. Subsequent reports are processed with the newly added symbols. For more information, see Object Reprocessing.
Missing Symbols
Symbol Fundamentals
Symbols play a crucial role in generating callstacks for minidumps by associating memory addresses in a dump with the corresponding function names. In 64-bit builds, debug information is stored in executable files, which are necessary in addition to symbol files for complete callstack resolution. Backtrace supports various methods of providing symbols and executables, including custom symbol server integration, automated uploads in the build pipeline, manual uploads through the UI or via curl.
Determining Missing Symbols
To resolve missing symbols, the first step is to identify which symbols are missing.
Missing Symbol Files
Backtrace indicates that a crash report is missing symbols by setting an attribute, _missing_symbols, to 1, and in the debug view UI (in the callstack and the global annotations sections).
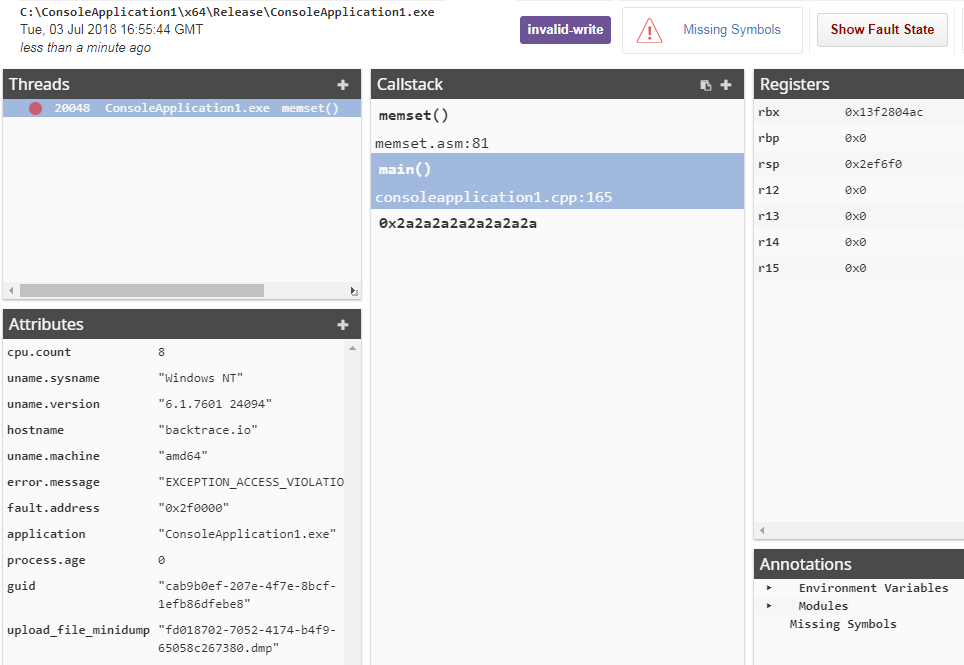
When a crash report is missing standard symbol files, in the debug view, you'll see a memory address in the callstack with an orange triangle missing symbol icon.
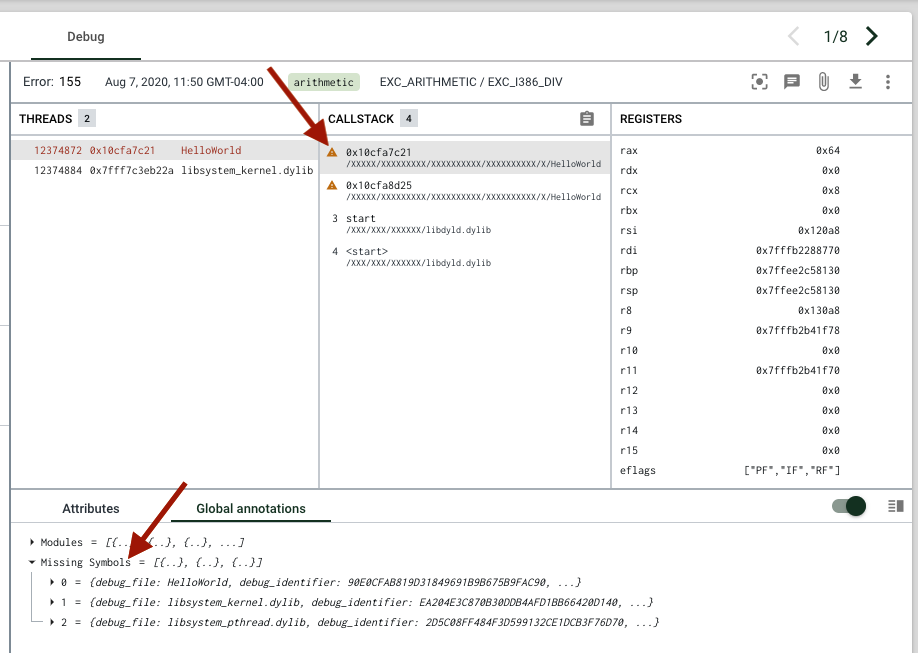
You can hover over callstack frames missing symbols to see more information (like the file path and debug ID)
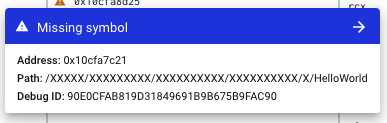
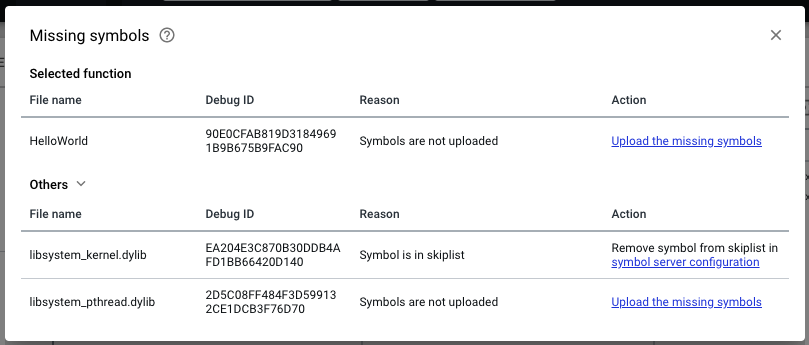
and you can click the blue missing symbol header to see additional missing symbol information.
Missing Executable Files
The debug view similarly indicates when a crash report is missing debug information from executable files, also known as Call Frame Information (CFI). The callstack section will show a guessed function name or a memory address in gray font, and the frame will be enclosed in <>.
Upon hover, you'll see a "missing CFI" message with details about the missing file.
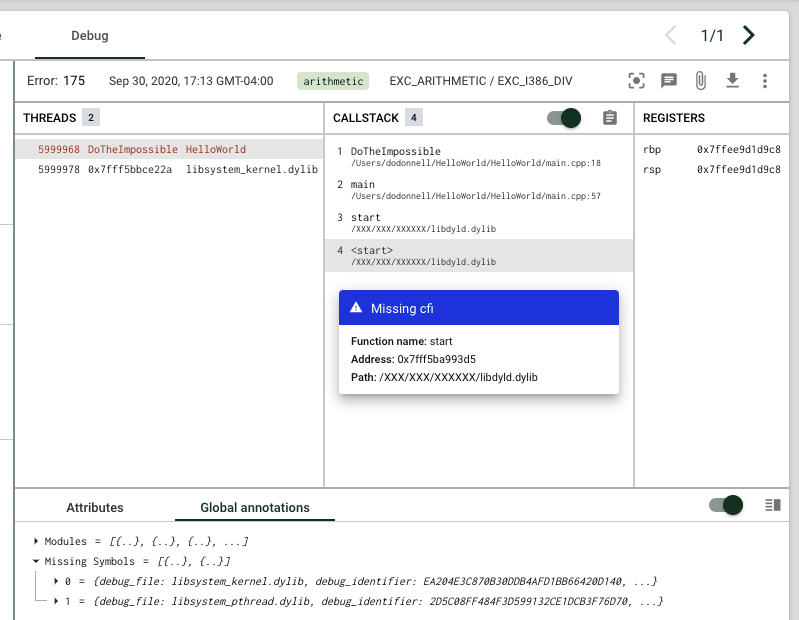
If either of the filename or the debug ID are missing in this hover message, then you can search the global annotations modules section for whichever information (the debug ID or filename) was provided to find the missing portion from the corresponding symbol file entry.
These options should be sufficient in determining what symbols are missing from a crash report. Contact our Support team if you need additional assistance.
Supplying Missing Symbols
For Backtrace to provide complete callstack resolution, the missing symbols must be supplied and the previously received crashes corresponding to those symbols must be reprocessed. How this is completed depends on users' symbol upload workflow.
Manual Upload
If you are uploading symbols manually, your next steps will be to retrieve and upload those symbols to Backtrace. After uploading missing symbols, corresponding crashes should be reprocessed in order for the symbols to apply.
Custom Symbol Server Integration
If you are using a custom symbol server, then your next step will be to verify that the symbol exists on the symbol server in the proper directory structure (that is, <url>/<object_name>/<debug_id>/<file>). If it does not, then you know why it did not apply.
If it does exist and reprocessing does not correct it, then there are a few additional things to check. These items to check live in the symbol server section of your project settings (navigate from the Main Menu > Project Settings > Symbols > Symbol Servers), unless otherwise noted.
- White list: If this optional configuration is enabled, then a symbol's name must exist on the white list in order for Backtrace to download it from the symbol server.
- Skip list: Symbol name and debug ID combinations that fail to download from a custom symbol server are added to a skip list so that requests are not made for symbols which do not exist on the server. If a symbol that previously did not exist on the symbol server was uploaded, its name and debug ID may exist on this list. Removing the name and ID from the skiplist and reprocessing the crash object will allow the symbol to download. The symbols can removed from the skip list tab of the symbol server entry, or via our command line tool, morgue.
- Logs: The symbol server entry's logs tab can be searched for additional information about the symbol download attempts and results / error messages. Searching the logs for the symbol's debug ID is generally most efficient. Note that we'll log a 200 upon successful download of a symbol, and common errors logged for failed downloads include 404, 401, etc.
- Misc: Backtrace applies downloaded symbols to all threads, but only downloads new symbols from the faulting thread. If the missing symbol is in a nonfaulting thread, it will not be downloaded from a custom symbol server. To workaround this, a symbol can be manually downloaded from the symbol server, uploaded to Backtrace, and then the crash can be reprocessed. Alternatively, the crash can be resubmitted with the thread in question marked faulting (using a modifier) and later deleted as needed. After the symbol is downloaded from the symbol server, it will apply to all threads of new or reprocessed crashes.
Processing Missing Symbols on a Non-Faulting Thread
For a number of reasons (storage / performance), Backtrace does not by default process symbols which are only relevant to the non-faulting thread. However, the debugger does have a feature that will let you pull that information if it is relevant to your debugging.
First, there are a few prerequisites to enabling this functionality:
- You must be an admin
- Your instance's
_BACKTRACE_PROMPT_MISSING_SYMBOLSwindow variable must be set totrue. This can be changed by SSH into your coronerd instance and editing the.../coronerd/coronerd.conffile. The system must detect missing symbols on the non-faulting thread when you open an error report in the debugger (this is checked / happens automatically) If all of the above are true, you will see an icon/button show up on the top right corner of the debugger as shown below.
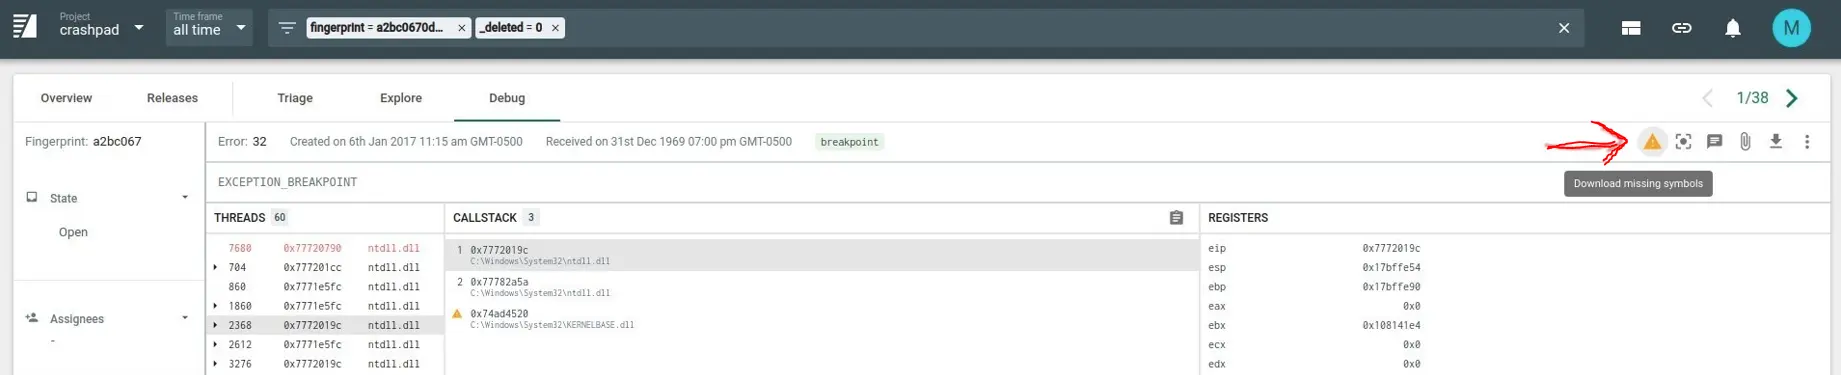
Pressing this button will bring up a window confirming whether or not you want to download + process the symbols that are missing. Confirming this will kick off the process for you (it might take a few seconds to complete).
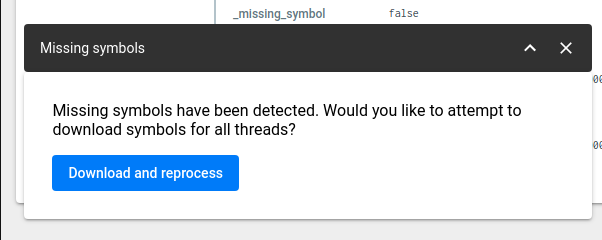
You must have actually provided / uploaded the symbols in question. If you haven't done so, then the missing symbols errors wont be resolved. If that is the case, you can follow the guide outlined about around how to upload missing symbols.
Resolving Missing Symbols
Once missing symbols are uploaded or obtained from a symbol server, and the relevant crashes are reprocessed, the callstack will resolve completely.
Contact our Support team if you need additional assistance.
Why Are Aggregate Filters Removed In Certain Views?
Aggregation filters are used to filter the results of aggregations, which are performed on a per-group basis. For instance, in the triage view, the results are grouped by fingerprint by default, and aggregation filters are applied to each group's aggregations. In the explore view, users have the option to either group all results into one group or group them based on arbitrary attributes.
In an upcoming release, aggregation filters will be implemented to support flame graphs.
However, aggregation filters will not be available in the debugger or list views, as these views utilize selection queries that do not involve aggregations.
Error Processing Modifiers
Backtrace supports the following modifier attributes:
-
_mod_faulting_tid: This attribute can be set on the object submission of minidump objects. If set, it specifies the thread to use for deduplication. The value is the integer identifier of a thread. Typically, this is used to incorporate watchdog systems for detecting hung threads. -
_mod_sync: This attribute can be set on the submission of any error object. It specifies that the object processor in Backtrace must respond only after the object has been evaluated and indexed. This may impact response latencies but allows for more comprehensive responses and advanced workflows, such as leveraging submission buckets. It is also valuable during debugging. -
_mod_log: This attribute can be set on the submission of any error object. Enabling it includes a detailed trace buffer of object processing in the response. This may impact response latencies but is valuable for debugging purposes.
The following modifier is considered advanced (consult Support before enabling):
_mod_fingerprint: This attribute can be set on submission. Its value must besha256. If set, it bypasses the default fingerprinting algorithms and creates a fingerprint based on the SHA256 for a given crash.
How Much Disk Space Do Crash Dumps Take in Backtrace?
To estimate the total size of your crash dump metadata, you can use the following formula:
8 bytes * number of attributes * number of crashes
To estimate the total disk space used by the crash dumps themselves, you can multiply the average size of your crash dumps by the estimated volume.
How Do I Delete a Project?
Reach out to support if you wish to delete a project.
We are aware this is not optimal and plan to allow users to manage project deletions themselves soon.
What Version of jemalloc Does Ptrace Support?
Any of version of jemalloc before version 5 is supported with ptrace.
Improving Unwinding Accuracy for Windows
On Windows, 64-bit applications store some unwinding information exclusively in the executable object (.exe or .dll file). Therefore, it is advisable to include the executable code of your application and library when uploading symbols. These files can be uploaded as standalone files, but it is essential to ensure that the file base name matches the base name of the corresponding .pdb file. For instance, if the executable is named Editor.exe, the debug information should be stored in Editor.pdb. It is crucial to maintain this naming consistency, as the executable's name must match the associated .pdb file. If the executable is uploaded as Word.exe, it will not be possible to pair it with Editor.pdb. To ensure proper pairing, it is recommended to use a symbol archive.
How Can I Login to the Morgue Tool Via SSO?
Direct login to Morgue using an SSO-only account is not supported. However, there is a workaround available:
- Start by logging into the Backtrace UI as you normally would.
- Next, navigate to the account page under Universe settings (https://youruniverse.sp.backtrace.io/settings/me)
- Copy the "Command line login"
Paste the provided command to login:
morgue login https://youruniverse.sp.backtrace.io --token=yourtoken
The token may be reset during server restarts or maintenance. If you encounter any messages regarding invalid tokens or authentication issues, repeat the steps above.
missing_symbol Attribute
The _missing_symbol attribute is a boolean that indicates whether an object has any private missing symbols. A private missing symbol refers to a symbol that is not included in either the blocklist or allowlist of our symbol management daemon.
You can utilize the _missing_symbol attribute to identify crashes that either have missing symbols or do not have missing symbols.
Changing the Displayed Timezone
Backtrace suggests installing a browser extension to modify the displayed timezone in our Web UI. According to feedback from Backtrace users, the Change Timezone extension for Chrome has been reported to work effectively. You can find it at this link: Chrome Web Store - Change Timezone.
For Firefox users, there is a similar plugin available at: Firefox Add-ons - Change Timezone.
How Do I Backup My Backtrace On-Premises Server?
To backup your on-premises coronerd installation, you'll need to backup the settings and the data folders.
Settings
Coronerd stores its settings in /etc/coronerd - make sure to include this entire folder in your backup. This will include your coronerd.conf file as well as your coronerd.db configuration database - you will need both to restore your system.
The path to coronerd.db is configured in /etc/coronerd/coronerd.conf in the setting configuration - if you've relocated this file, refer to this setting for the proper path.
Data
By default, coronerd stores its data under /var/coronerd - make sure to include this folder and all subfolders in your backup.
This path is determined by "storage": { "disks": [ ... ] } in your coronerd.conf file, so if you're using an alternate location, verify it here.
For Users of Symbold
If you're using symbold, make sure to include /var/symbold in your backup.
This path is determined by "symbold": { "symbol_path": "..." } in coronerd.conf.
For Users of backtrace-saml
If you're also running the backtrace-saml service, make sure to backup the folder /opt/backtrace/backtrace-saml, which should also include the saml.json file. Depending on your configuration, this may be on the same or different server than where coronerd is running - see the "saml": { "provider": "..." } setting in your coronerd.conf.
Folder Structure
Dump files and snapshots are stored in /var/coronerd///_objects
Query data is stored in /var/coronerd///crdb and /var/coronerd///database
Can We Upload Different Versions of Symbol Files For One Executable?
You can upload symbol files for different versions of the same executable, and the Backtrace system will ensure that they are correctly identified without overwriting older versions. It will then match crash dumps to the corresponding symbol files.
This matching process is achieved by comparing an internal identifier present in both the dump and symbol files. For more details about our symbol management system, see, Symbolication.
I Need Help Registering For a Free Trial
The Subdomain field is a user-entered field that plays a crucial role in accessing your Backtrace instance. After you have completed the registration process, you can sign in to Backtrace by visiting: https://[subdomain].sp.backtrace.io.
While entering a value in the Subdomain field, there are certain limitations to consider. If you try to input a value that is already being used by another user, our system will reject it, and you will need to choose a different value.
It is recommended to create a unique and memorable subdomain, such as using your company or project name.
What Happens If I Hit My Crash Limit?
After you reach the limits of your current plan, Backtrace will no longer accept additional crash submissions. However, you can continue using the Console UI without any disruption. The crash submission limit will be reset at the beginning of each month.
If you require a higher crash submission limit, we recommend upgrading to a plan with a higher limit or exploring our Enterprise offering.
Even though invalid object submissions will not be visible in your Backtrace instance, they still count towards your submission limit. If you submit invalid objects, you may notice a difference between your upper submission limit and the number of crashes reported in Backtrace.
Vectored Exceptions With Crashpad
To handle Vectored Exceptions with Crashpad, one does need to do the following:
- Integrate Crashpad.
- Create a handler function with the following signature:
LONG WINAPI (PEXCEPTION_POINTERS) - Register the global exception handler, or use the handler in a
__try /__exceptblock.
Exception Codes
0xC0000005 - Access Violation
0xE06D7363 - External Exception
0xC0000374 - Heap Corruption
0xC000008E - Float Divide By Zero
0xC0000094 - Integer Divide By Zero
0xC000001D - Illegal Instruction
Integrating Crashpad
See the Crashpad Integration Guide.
Creating the Handler Function
MSDN contains the documentation. An example function handling Access Violation errors (0xC0000005).
LONG WINAPI VectoredExceptionHandler(PEXCEPTION_POINTERS pExceptionInfo)
{
    // Access Violation
    if (pExceptionInfo->ExceptionRecord->ExceptionCode == 0xC0000005) {
        // CrashpadClient client;
        // The client is already initialized, you can look at the
        // integration article for an example

        client.DumpAndCrash(pExceptionInfo);
        return EXCEPTION_EXECUTE_HANDLER;
    }

    return EXCEPTION_CONTINUE_SEARCH;
}
Registering the Handler Function
Registering the Handler function is done by the AddVectoredExceptionHandler function:
AddVectoredExceptionHandler(0, &::VectoredExceptionHandler);
Using the __try/__except Block
Pass the handler function as an argument to __except. Feed it PEXCEPTION_POINTERS from GetExceptionInformation() :
__try {
    memset(nullptr, 42, 2000000);
}
__except (VectoredExceptionHandler(GetExceptionInformation()))
{
    printf("all is good\n");
}
The result
If the necessary symbols have been uploaded, the uploaded minidump should contain the necessary information about the callstack, if at all possible. Certain error scenarios, i.e. stack smashing, that render this impossible.
What Is a Debug Identifier?
This little guide describes the generation of debug ids across various platforms and how they are being used to find debug information.
ELF/Linux Linux object files carry a debug id (occasionally also called Build ID), to identify a particular shared object and uniquely associate its corresponding debug information in case they are stripped and stored in a separate file. The debug id is stored in the notes section of ELF objects and can be queries with various tools, e.g. readelf -n .
On Linux, the build id is generated by the linker. The GNU ld linker can be instructed to generate different forms of build ids depending on the switch --build-id. It supports generating SHA-1, MD5 or UUID identifiers as well as specifying a custom generated debug id. The default is using the SHA-1 checksum as build id. The computation of the checksums is depending on the platform (CPU architecture etc.) but the code tries to ensure that given same inputs, the same debug id is being generated. This happens by only hashing the ELF headers as well as stable ELF content sections.
During creation of RPM packages, rpmbuild's macros will call down to debugedit and cause a regeneration of build ids. The regeneration is done because file paths are affecting the debug id generation and rpmbuild builds in a temporary build root with different paths for each invocation. debugedit ensures that the generated build-ids are stable per invocation. This also helps with reproducible package builds. Debian/Ubuntu might have parallel tools sanitizing build-ids. The above mentioned distribution allow separate installation of debug information packages, which are being commonly indexed under the file hierarchy /usr/lib/debug by hash value.
How Can I Download a Minidump From Backtrace?
Console Debugger View
When viewing an error in the Backtrace debugger, you can click on the download icon on the upper right. This will give you the available formats to download a crash report.
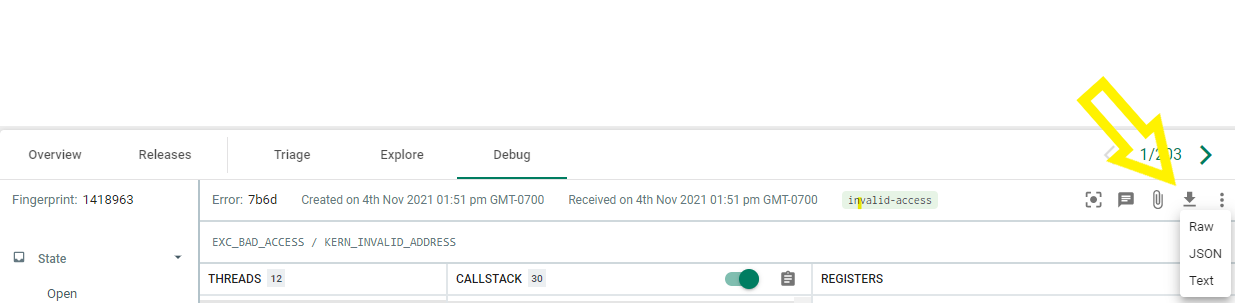
From this example, if we want the Minidump/dmp file, select the Raw.
Morgue CLI Tool
The command is:
morgue get <projectname> objectid -o /path/to/output.dmp
You can get the objectid by looking at the error in the Backtrace UI, it appears at the end of the URL when viewing an error in the debugger (debugger/objectid)
If you are unfamiliar with the Morgue CLI tool you can find learn more here: https://github.com/backtrace-labs/backtrace-morgue
Does Backtrace Support Unreal Crash Reporter Integration on Linux Environments?
No, Unreal crash reporting on Linux is not supported because the Unreal engine does not generate sufficient information in this environment. As an alternative, you can integrate our Crashpad integration for Linux crash reporting.
How Do I Troubleshoot a Backtrace Integration with Jira?
If you've set up a Backtrace integration with JIRA, but are not receiving any new JIRA issues from Backtrace, check on the following:
- Is your JIRA endpoint correct? Your Jira endpoint should end in /jira/rest/api/2/ or /rest/api/2/ , depending on your Jira configuration. Atlassian has recently released v3 in Beta, at this time it is not supported. Be sure to use a v2 endpoint.
- Is your project key correct?
- Does the JIRA user associated with the email you provided have permissions to create new issues in the project you specified?
- Are you using email/password or username/password combination instead of email/API Token or username/API Token? API Token can be obtained here.
- Do you have any required custom fields? If so, you'll need to provide values for these fields in the Custom Fields section of the Backtrace JIRA workflow configuration.
- Are you using an Issue Type other than "Bug"? If so, make sure to specify this in the Issue Type config setting.
- Does your screen have fields called "labels" and "description"? If one of these is missing, you'll need to specify an alternative for these in the Custom Field Mapping section.
For more details, see Jira Integration with Backtrace.
In Crashpad, Can I Call crashpadAnnotations->SetKeyValue() From Different Threads?
When calling crashpadAnnotations->SetKeyValue() from different threads, you must protect it with a mutex.
What Is a Submission URL?
The submission URL is the endpoint where you can send errors for Breakpad, Crashpad, or direct API.
For Backtrace-hosted instances, your submission endpoint for Crashpad looks like:
https://yourteam.sp.backtrace.io:6098
And for Breakpad and direct submission to the API or via curl :
https://yourteam.sp.backtrace.io:6098/post?format=minidump&token=
..where yourteam gets replaced by your universe name, and is your submission token.
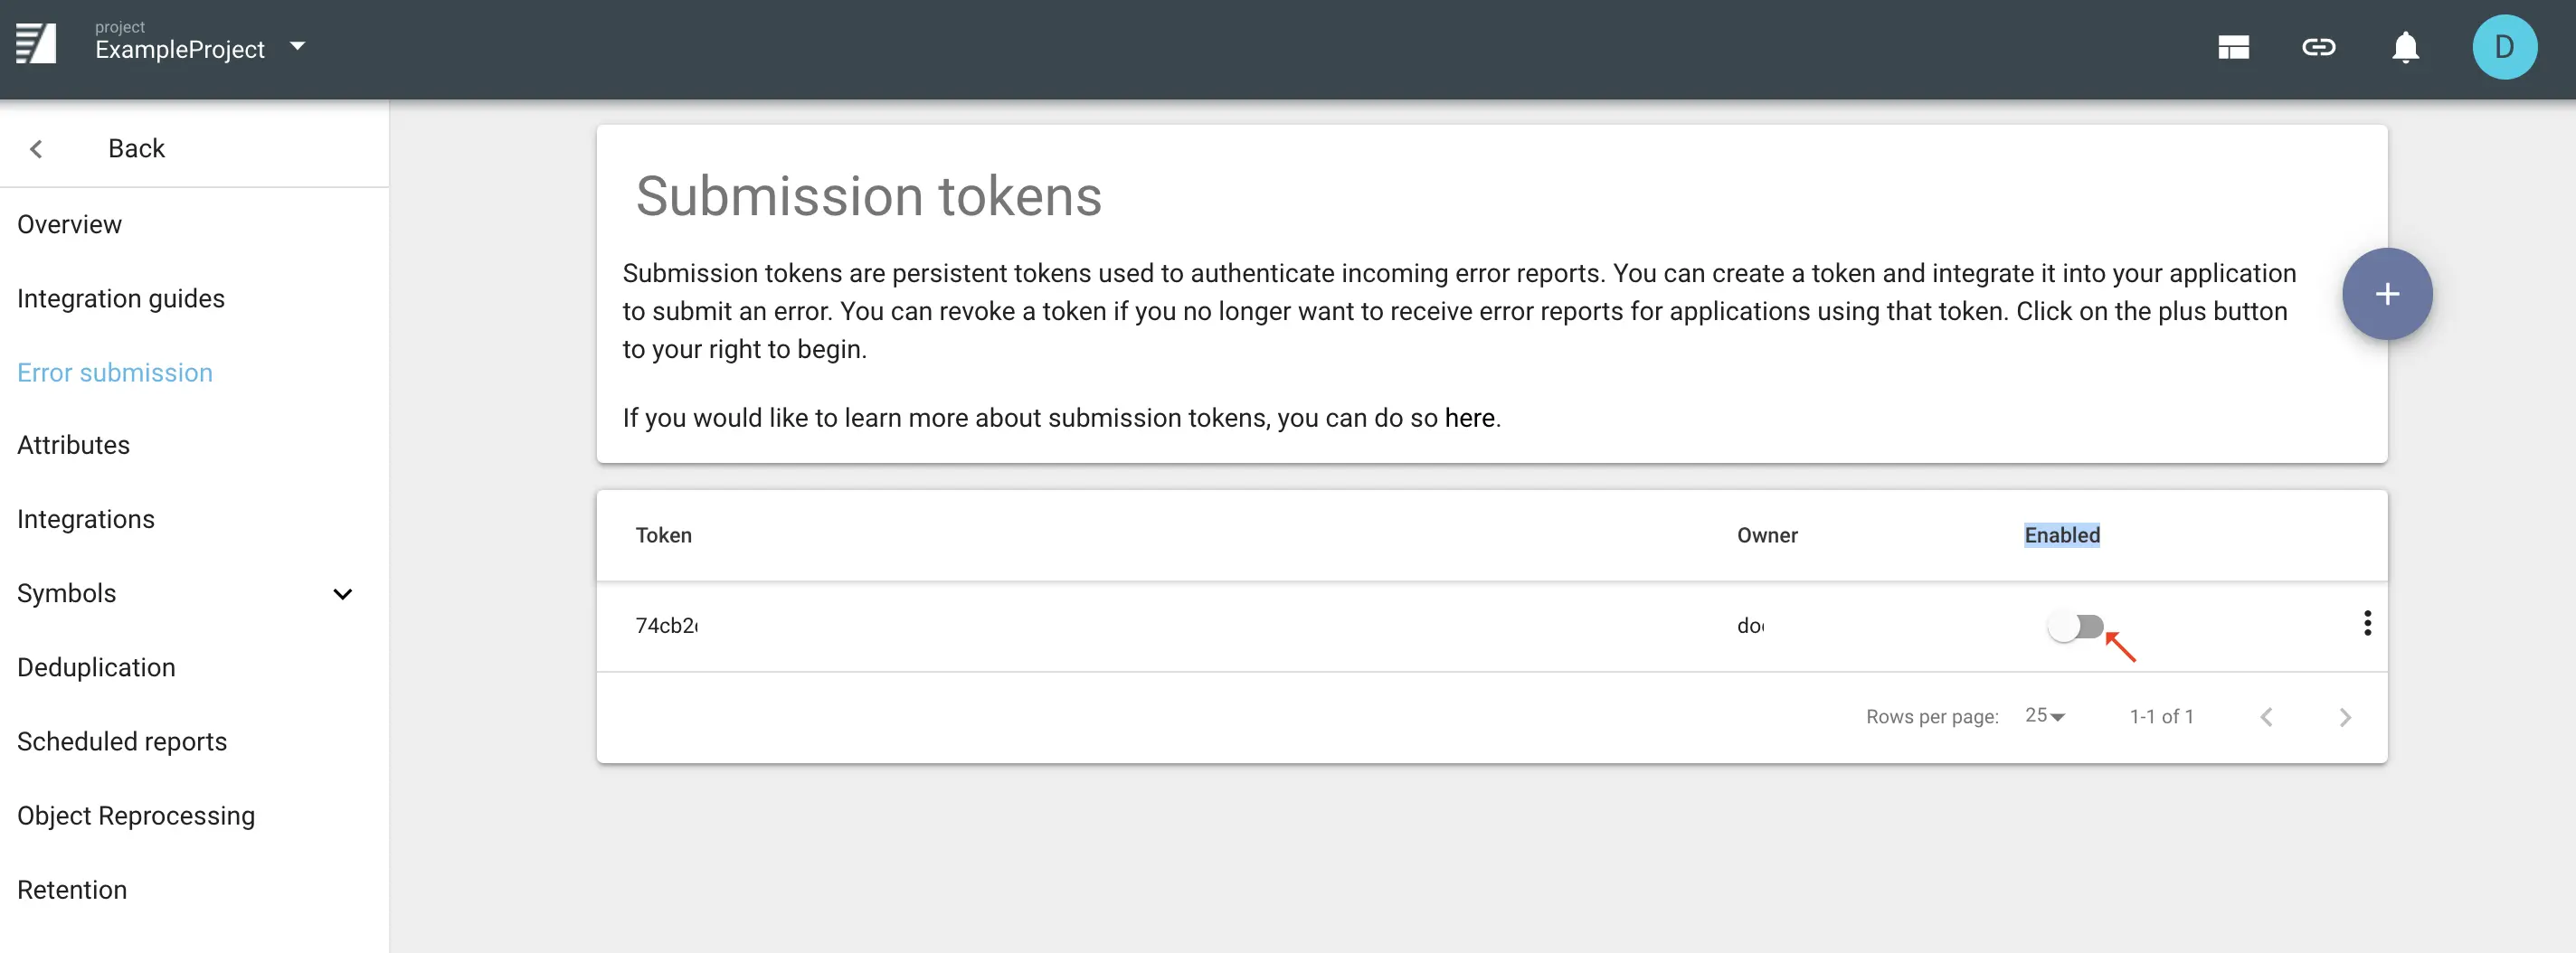
What Is a Submission Token?
A submission token is required to submit errors to Backtrace.
You can create and manage submission tokens in the Project Settings window's Error submission section.
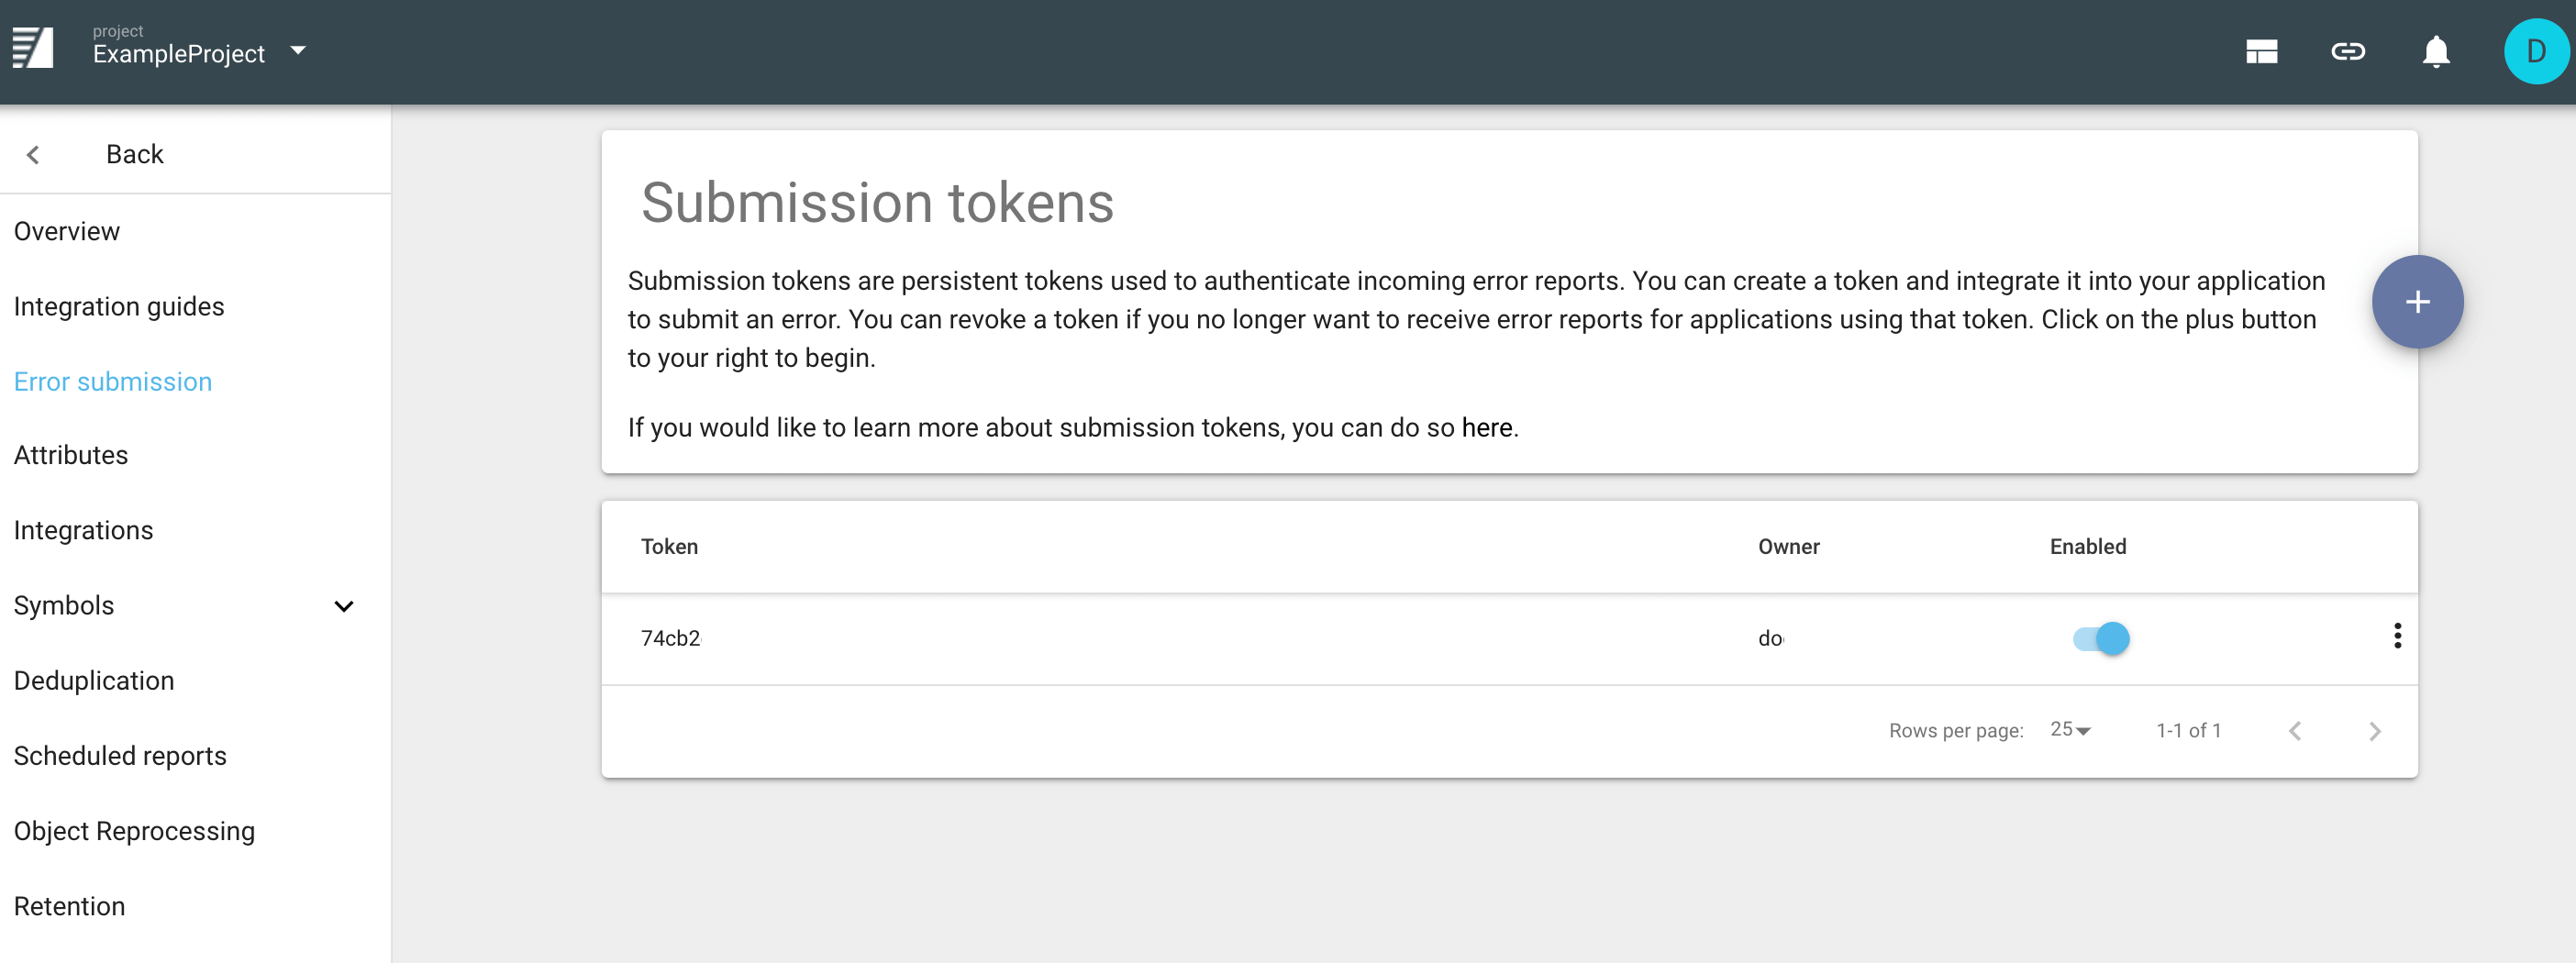
You can create different submission tokens for different purposes, such as one token for each production version of your software. This allows you flexibility to disable tokens for certain releases as your needs dictate.
Submission tokens are different from symbol upload tokens.
You can learn more about submission tokens and how to create them here.
What Are Symbols?
A symbol file contains extra debugging information about your errors. Customers who are uploading minidump-based errors are required to upload the symbol files for their application to see full callstacks.
For more information about symbol file management, see Symbolication.
What Is a Workflow Integration?
A workflow integration allows Backtrace to notify third-party services when it receives a new error. If you want Backtrace to send a message on a messaging platform, or create a ticket in a ticket tracking system, a workflow integration is the way to go.
For more information about workflow integrations, see Workflow Integrations Overview.
What Is a Project?
A project is a high-level organizational unit in the Backtrace platform. It is intended to group errors related to a particular project, application, or executable.
Is There A Limit On Symbol File Size Uploads?
There is no upper limit on the file size for symbol uploads or symbol archives. It is recommended to upload compressed archives or files to save on space.
Learn more in the Symbolication Guide.
How Do I Delete Errors or Dumps From The System?
Debug UI
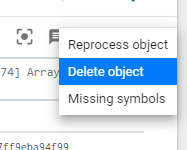
You can a single crash report from Backtrace UI Debug view by clicking on the three dot icon to the right:

After selecting this you should get the following menu:
Morgue
You can also delete objects via the command-line by using the morgue command-line tool https://github.com/backtrace-labs/backtrace-morgue#delete .
For example, if you wish to delete errors with IDs 10a1, 10a2, and 10a3 from the project "projectname": morgue delete projectname 10a1 10a2 10a3
Are Attributes Case-Sensitive?
Yes, attribute names are case sensitive. For example, apple , Apple and APPLE are considered different attributes by the Backtrace object store.
Why? There is existing software that utilizes multiple attributes that differ only by case.
How Do I Create Backups of The Object Store?
Copy your coronerd.db and coronerd.conf files (typically in /etc/coronerd/ ) and your relevant data directories (specified in the disks array of your coronerd.conf ).
It is possible to make a remote copy with tools rsync. If the object store is not stopped, the database can be copied while in a dirty state (this is not true of actual objects), which can be rectified using the morgue repair command.
How Do I Repair A Corrupt Database?
An attribute database can get corrupted over time, if it happens the following message will appear each time coronerd is started:
[...] 2018-03-16 13:03:47Z [T0] [project_event:560] [ns /universe/project/crdb] Project's attributes crdb is corrupted
Before initiating the repair procedure, make sure you have a backup of the database in the event that something goes wrong.
To start the recovery procedure, use morgue in the following way
morgue repair <[universe]/project>
Can I Download Symbol Files That Have Been Uploaded?
Backtrace processes symbols into a highly-compressed proprietary format to reduce storage utilization and improve performance. Therefore, it is not possible to download the original symbol files.
If you are on-premise or in an enterprise account, it is possible to configure the object store to retain the originally uploaded files but note it will have an impact on storage capacity.
What Happens If I Upload Duplicate Symbols?
When you upload symbols matching the debug identifier and module name of already existing symbols, those symbols are replaced. Only the latest uploaded symbols for a module and debug identifier are used.