Debug
The Debug view allows you to see the error or state of archived dumps from crashes or running processes in the convenience of your web browser. The information you see in the Debug view is dependent on the source of the crash (a script, a minidump file, or the Backtrace proprietary format) and the data available (for example, threads, variables, memory segments, etc).
Overview
Below is a screenshot of the type of data you will see in the Debug view.
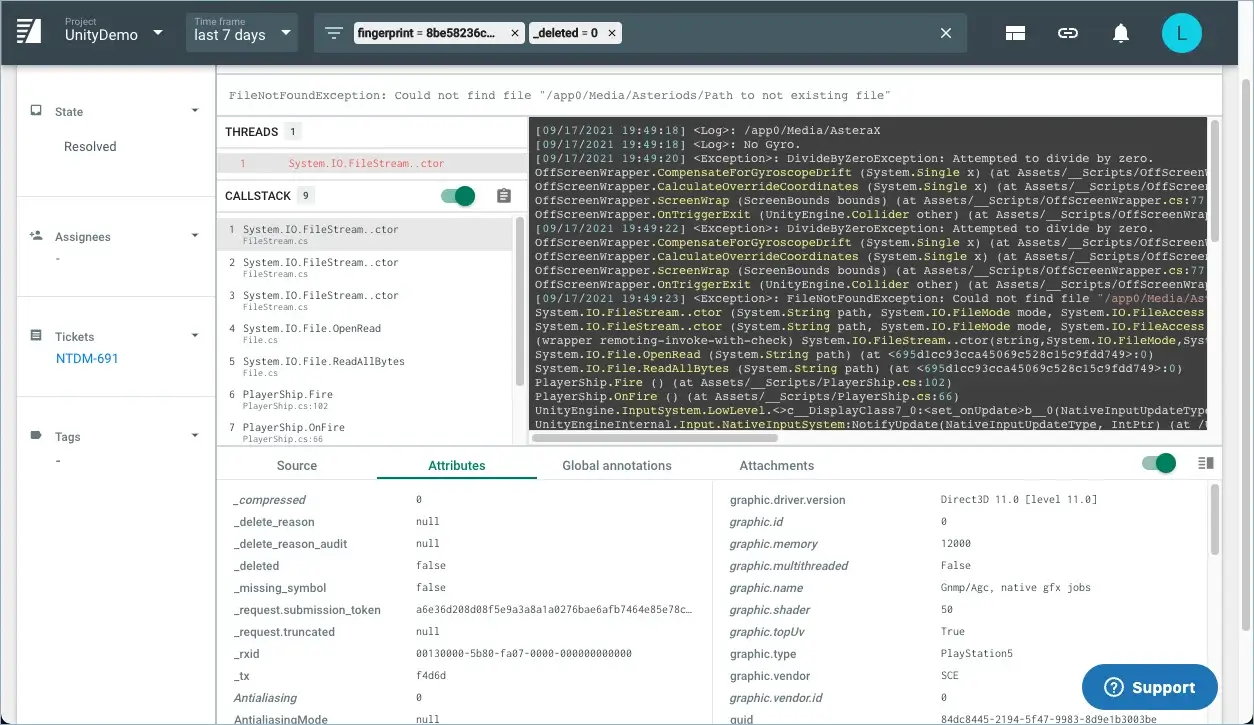
Depending on the type of information in the crash report, the Debug view will show different data. For example, the crash report for minidump files shows a set of callstacks from all the threads, and other details such as attributes, environment information, modules loaded, and missing symbols. The crash report for Backtrace core dump files (BTT) shows automated security and bug analysis, variables, and more.
The Debug tool is organized into several sections as described below.
General Information
This pane is present for the Backtrace snapshot format used on UNIX and UNIX-like systems. This includes memory map information, system information, register state, and more. The Process tab allows you to analyze the global state of the faulting process, which includes memory allocator metadata, such as recently reclaimed items, and more (depending on the allocator).
Threads
This pane contains a list of all threads in the dump. Threads that have crashed have a red icon next to them. Threads that have an arrow symbol next to them can be expanded to more threads with an identical callstack. In other words, threads are grouped into a tree if they have identical callstacks in order to ease navigating lots of threads.
Callstack
The callstack pane contains the callstack of the currently selected thread. Mousing over a frame will reveal additional interesting information about it. If a frame has an orange highlight, it is deemed more likely to be relevant to the crash.
Registers
This pane is present for dump formats such as minidump. It contains the register values for the currently selected frame.
Attributes
This pane is present for dump formats such as minidump. It contains a list of all attributes extracted from the dump and supplied during dump submission. Some of these attributes may already be indexed.
Global Annotations
This pane is present for dump formats such as minidump. This contains a tree list of other interesting data derived from the dump. This can include clues to the root cause of the crash, the list of loaded libraries, missing debug symbols and more.
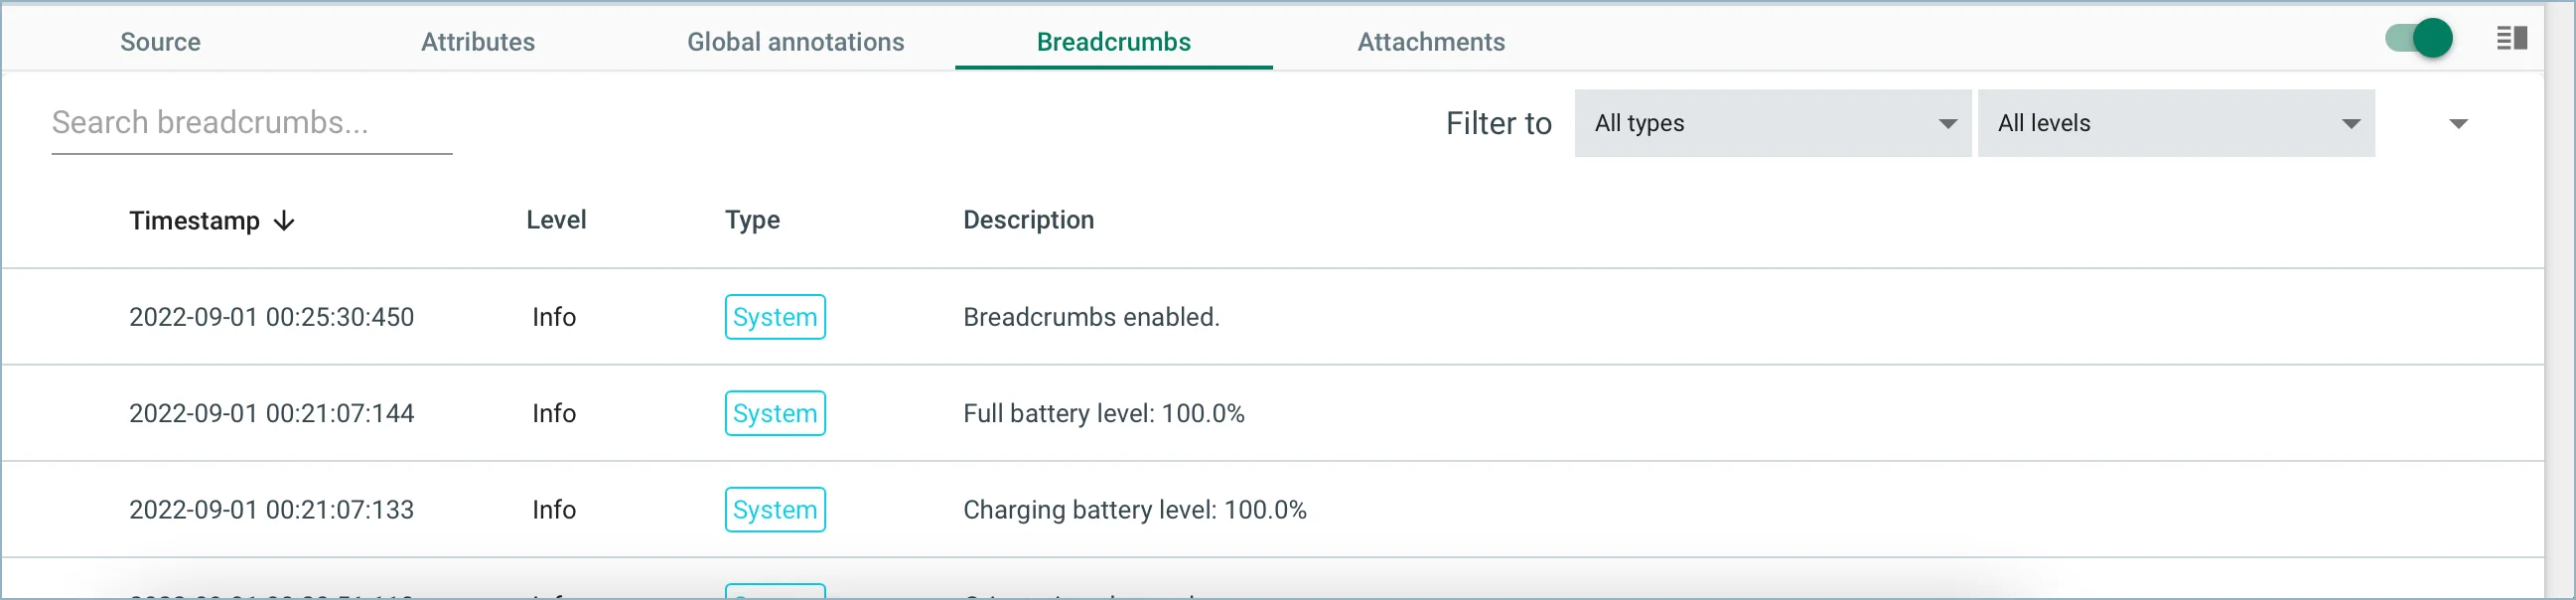
Breadcrumbs
This pane is present for the Backtrace SDKs that have the breadcrumb functionality enabled on the client. Breadcrumbs help you track events leading up to a crash, error, or other submitted object. You can also use automatic system breadcrumbs to track battery state changes, foreground/background switches, and memory events.
The breadcrumbs that are added depend on the SDK that you're using. For more information on which events are automatically captured or how to configure breadcrumbs, see Platform Integrations.
Global Variables
This pane is present for the Backtrace snapshot format used on UNIX and UNIX-like systems. It contains the values of any global variables that have been serialized.
Variable Context
This pane is present for the Backtrace snapshot format used on UNIX and UNIX-like systems. It contains auxiliary information about a variable such as the type and memory allocator state (size of allocation the variable points to and whether it is active or freed).
Variables
This pane is present for the Backtrace snapshot format used on UNIX and UNIX-like systems. Variables with a red box are currently freed. Variables with a green box are currently allocated. Variables with a red circle have warnings attached to them. Click on the variable to expand it and see any potential warnings.
Warnings
This pane is present for the Backtrace snapshot format used on UNIX and UNIX-like systems. Warnings may include invalid memory allocator state, automated detection of variables accessed when the crash occurred, and more.