Group Data by Attributes
The Explore view lets you analyze error data by grouping errors according to attributes such as fingerprint, account name, machine name, release channel, and other attributes available in your dataset. Grouping helps you identify patterns across different dimensions instead of analyzing errors only by their fingerprint.
Access Explore
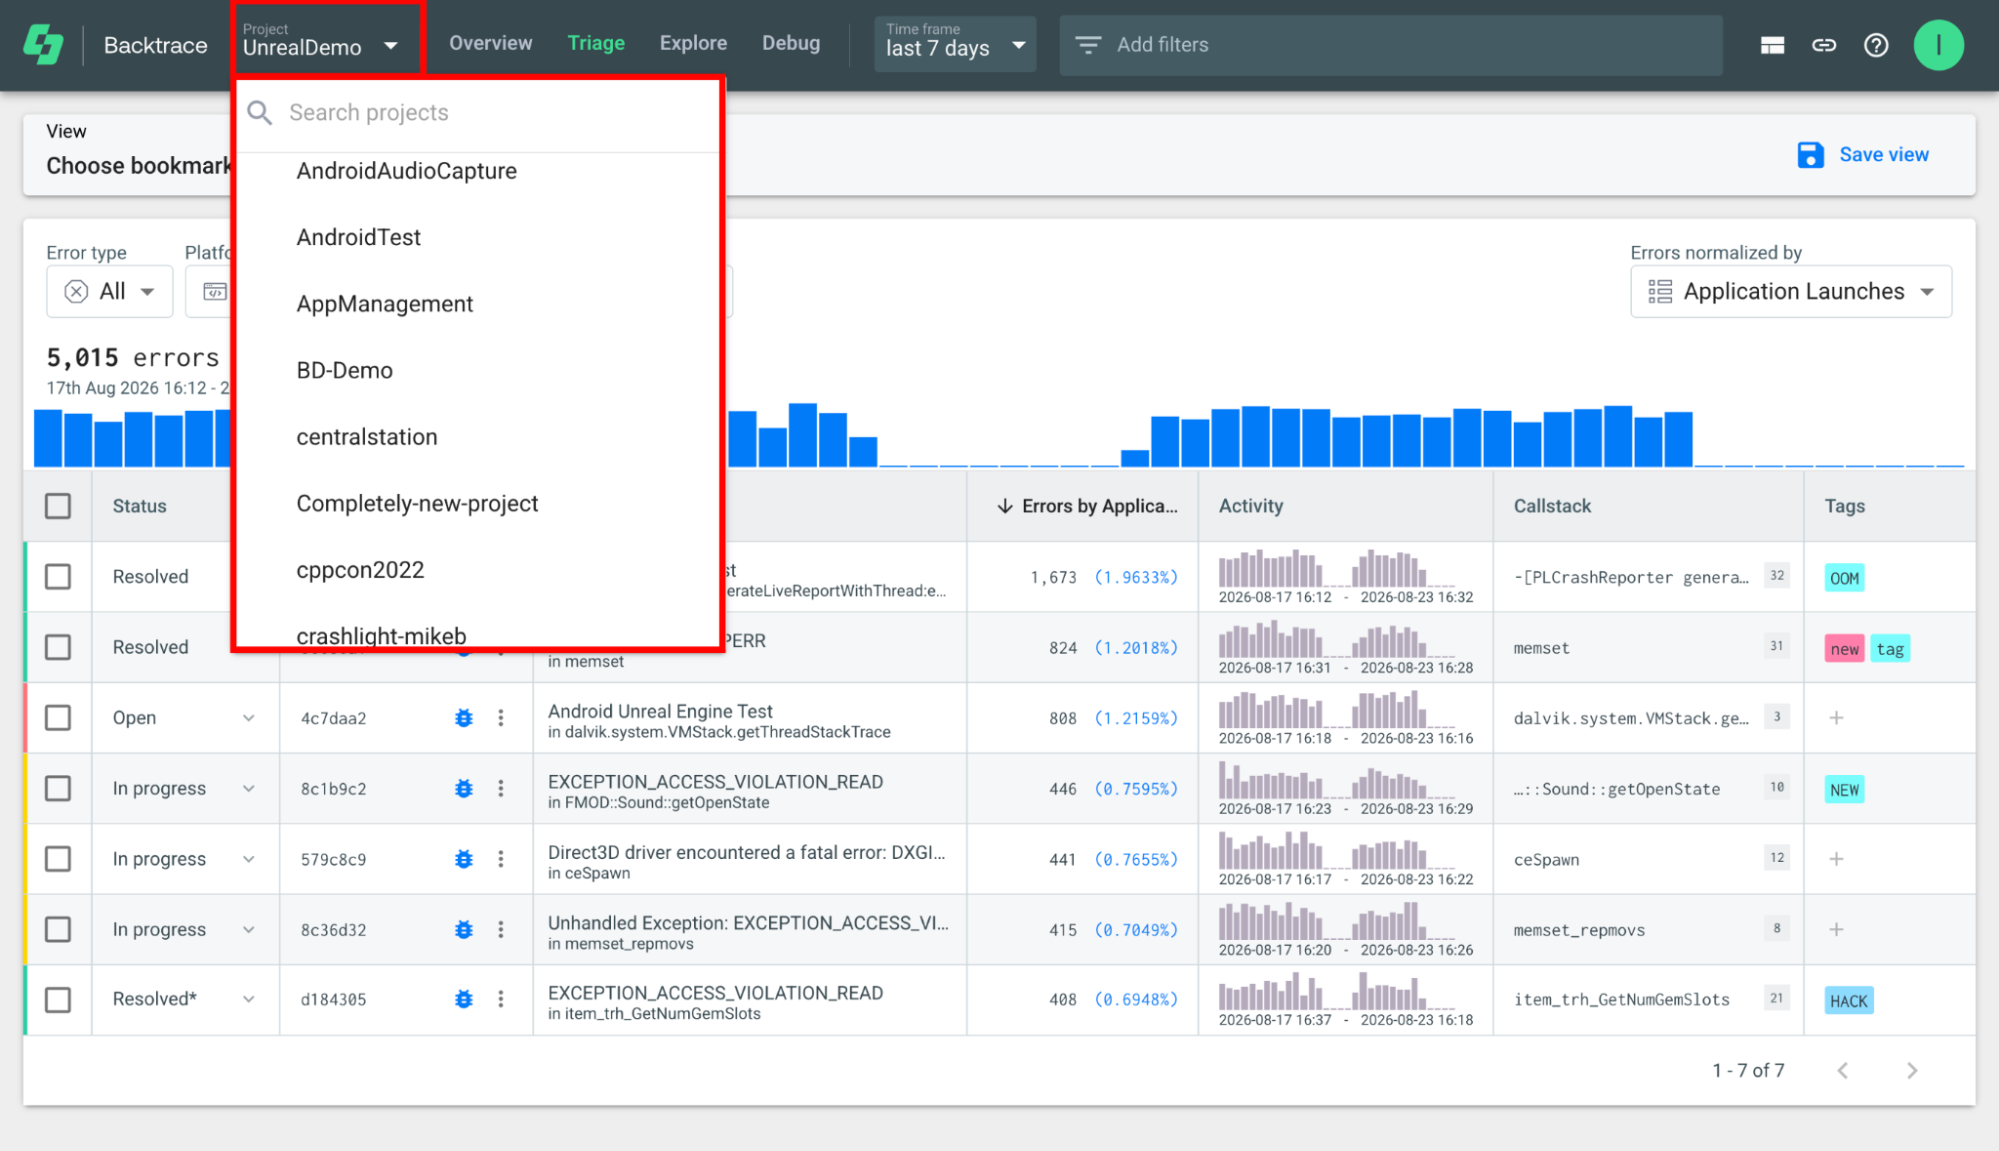
Step 1: Open the Error Reporting web console and select the project that contains the error data you want to analyze.
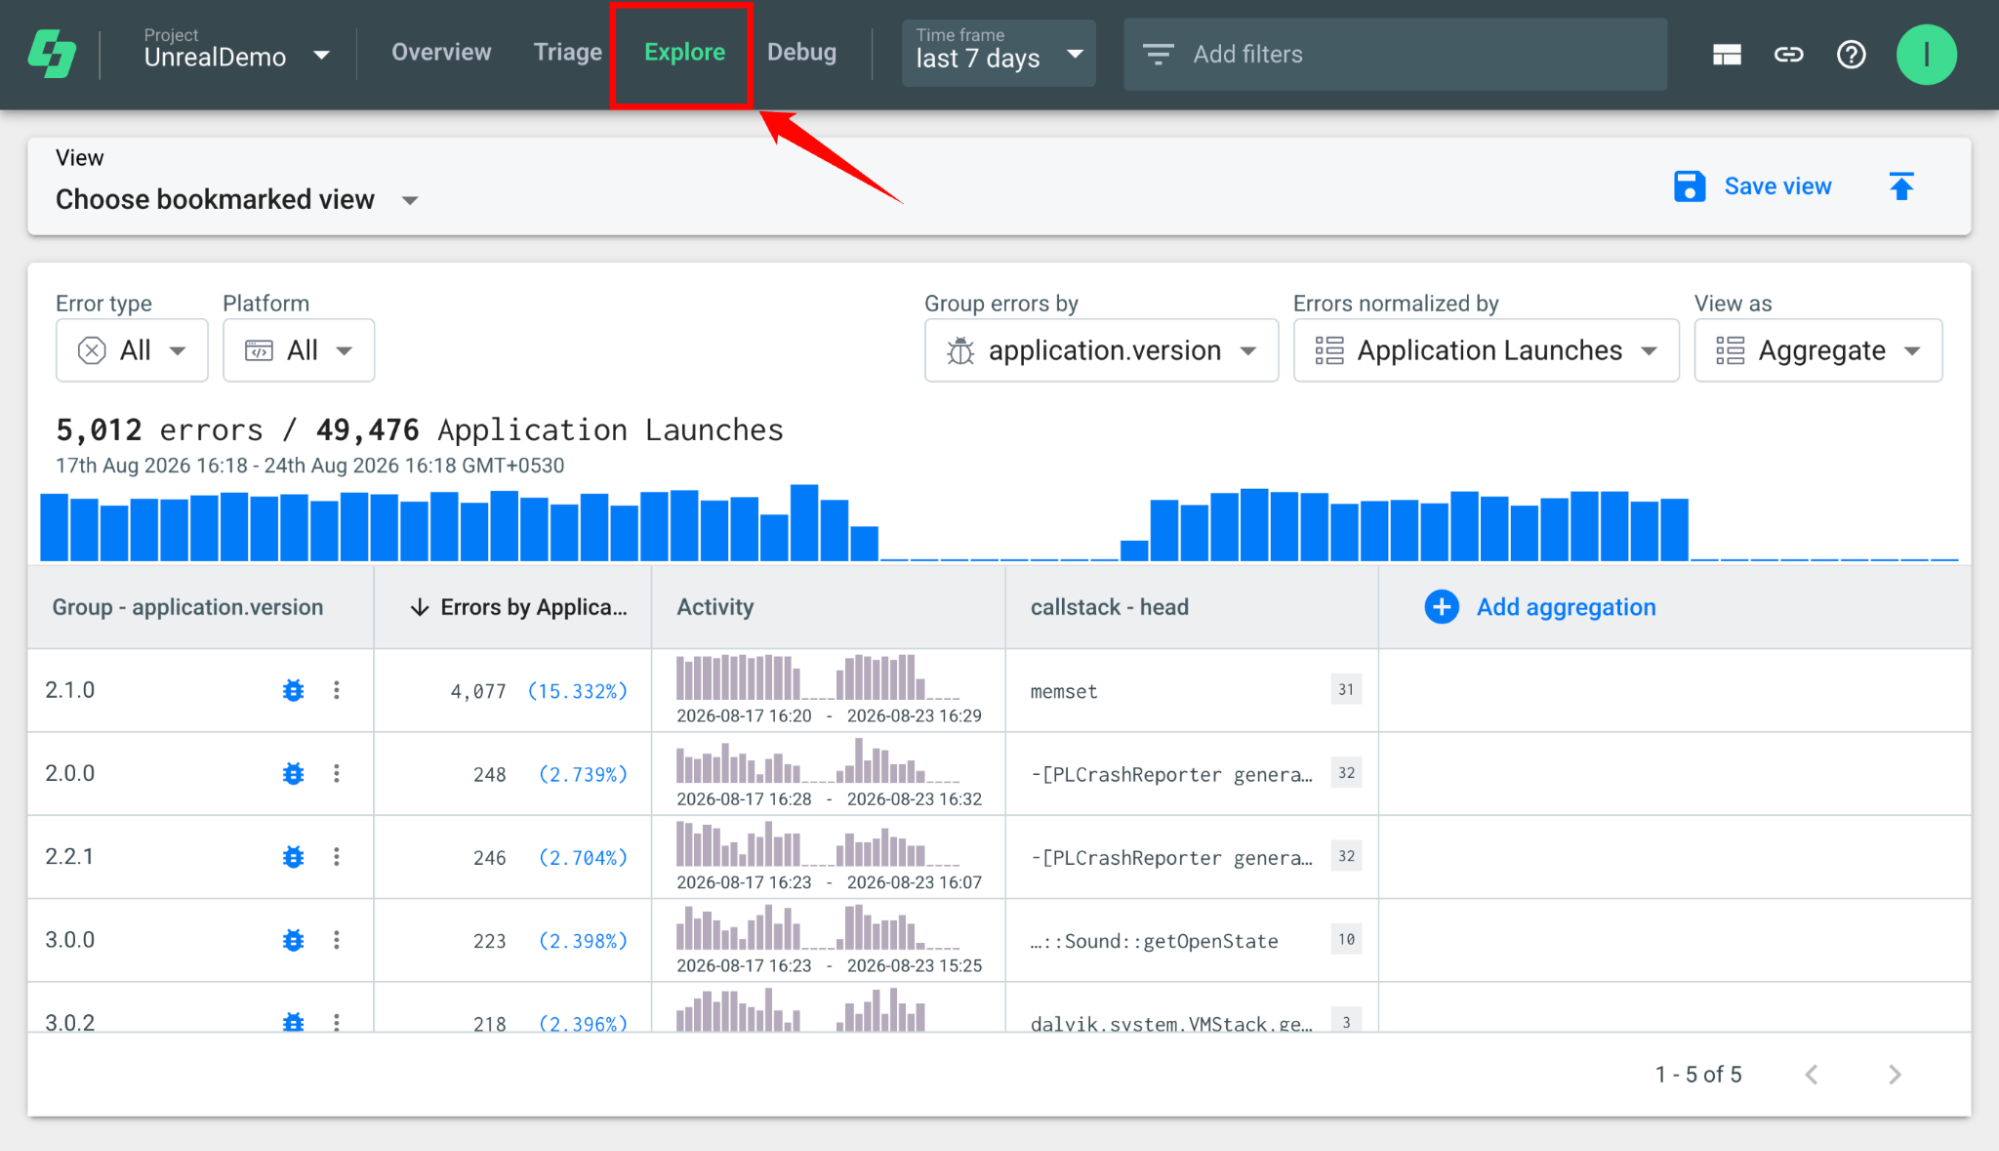
Step 2: From the top navigation, select Explore.
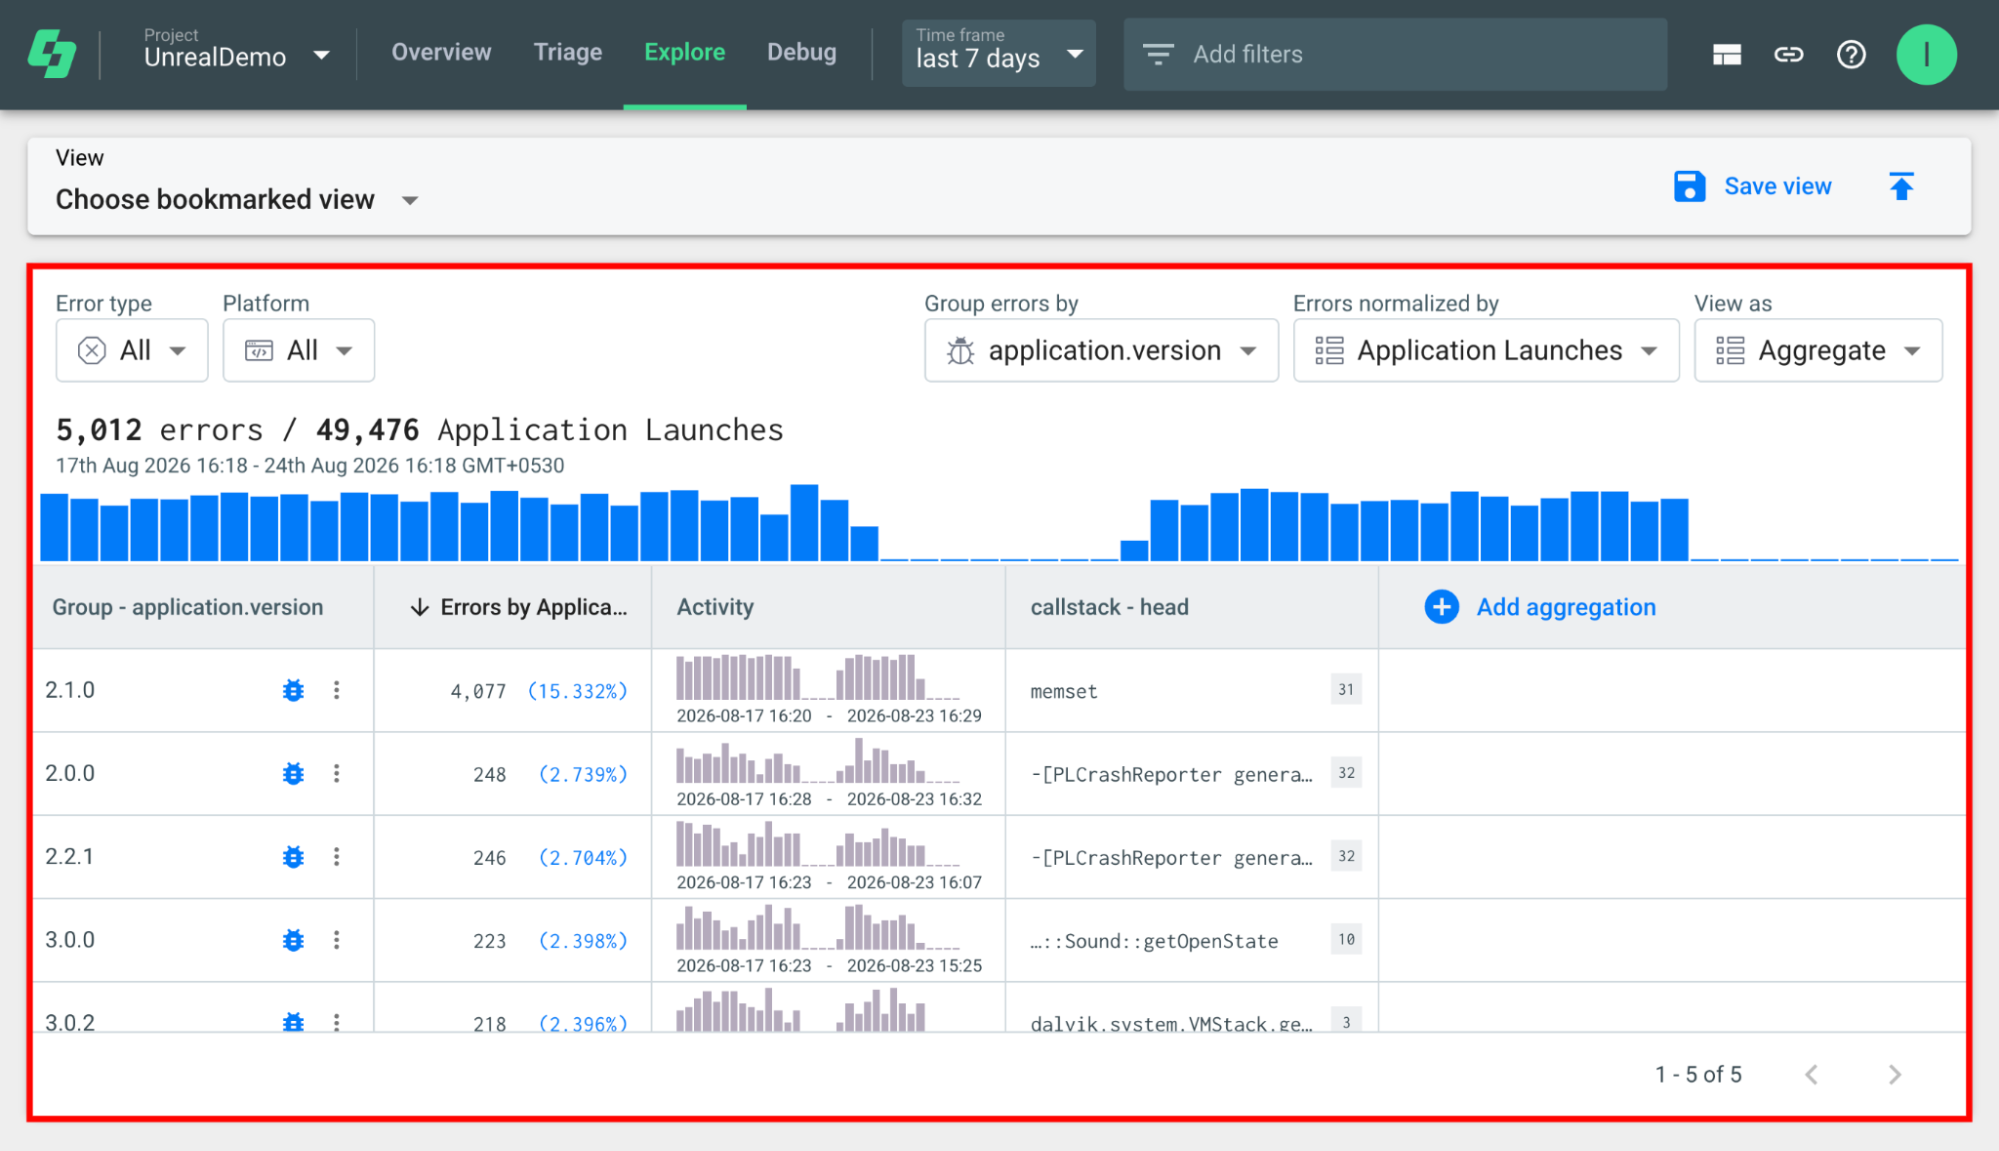
Step 3: The Explore view opens with your available error data and provides controls to filter, group, normalize, and customize how the results are displayed. These controls include Error type, Platform, Group errors by, Errors normalized by, and View as.
Filter the Error Data
Before grouping errors, you can use the Error type and Platform filters to limit the data included in the results.
Error Type
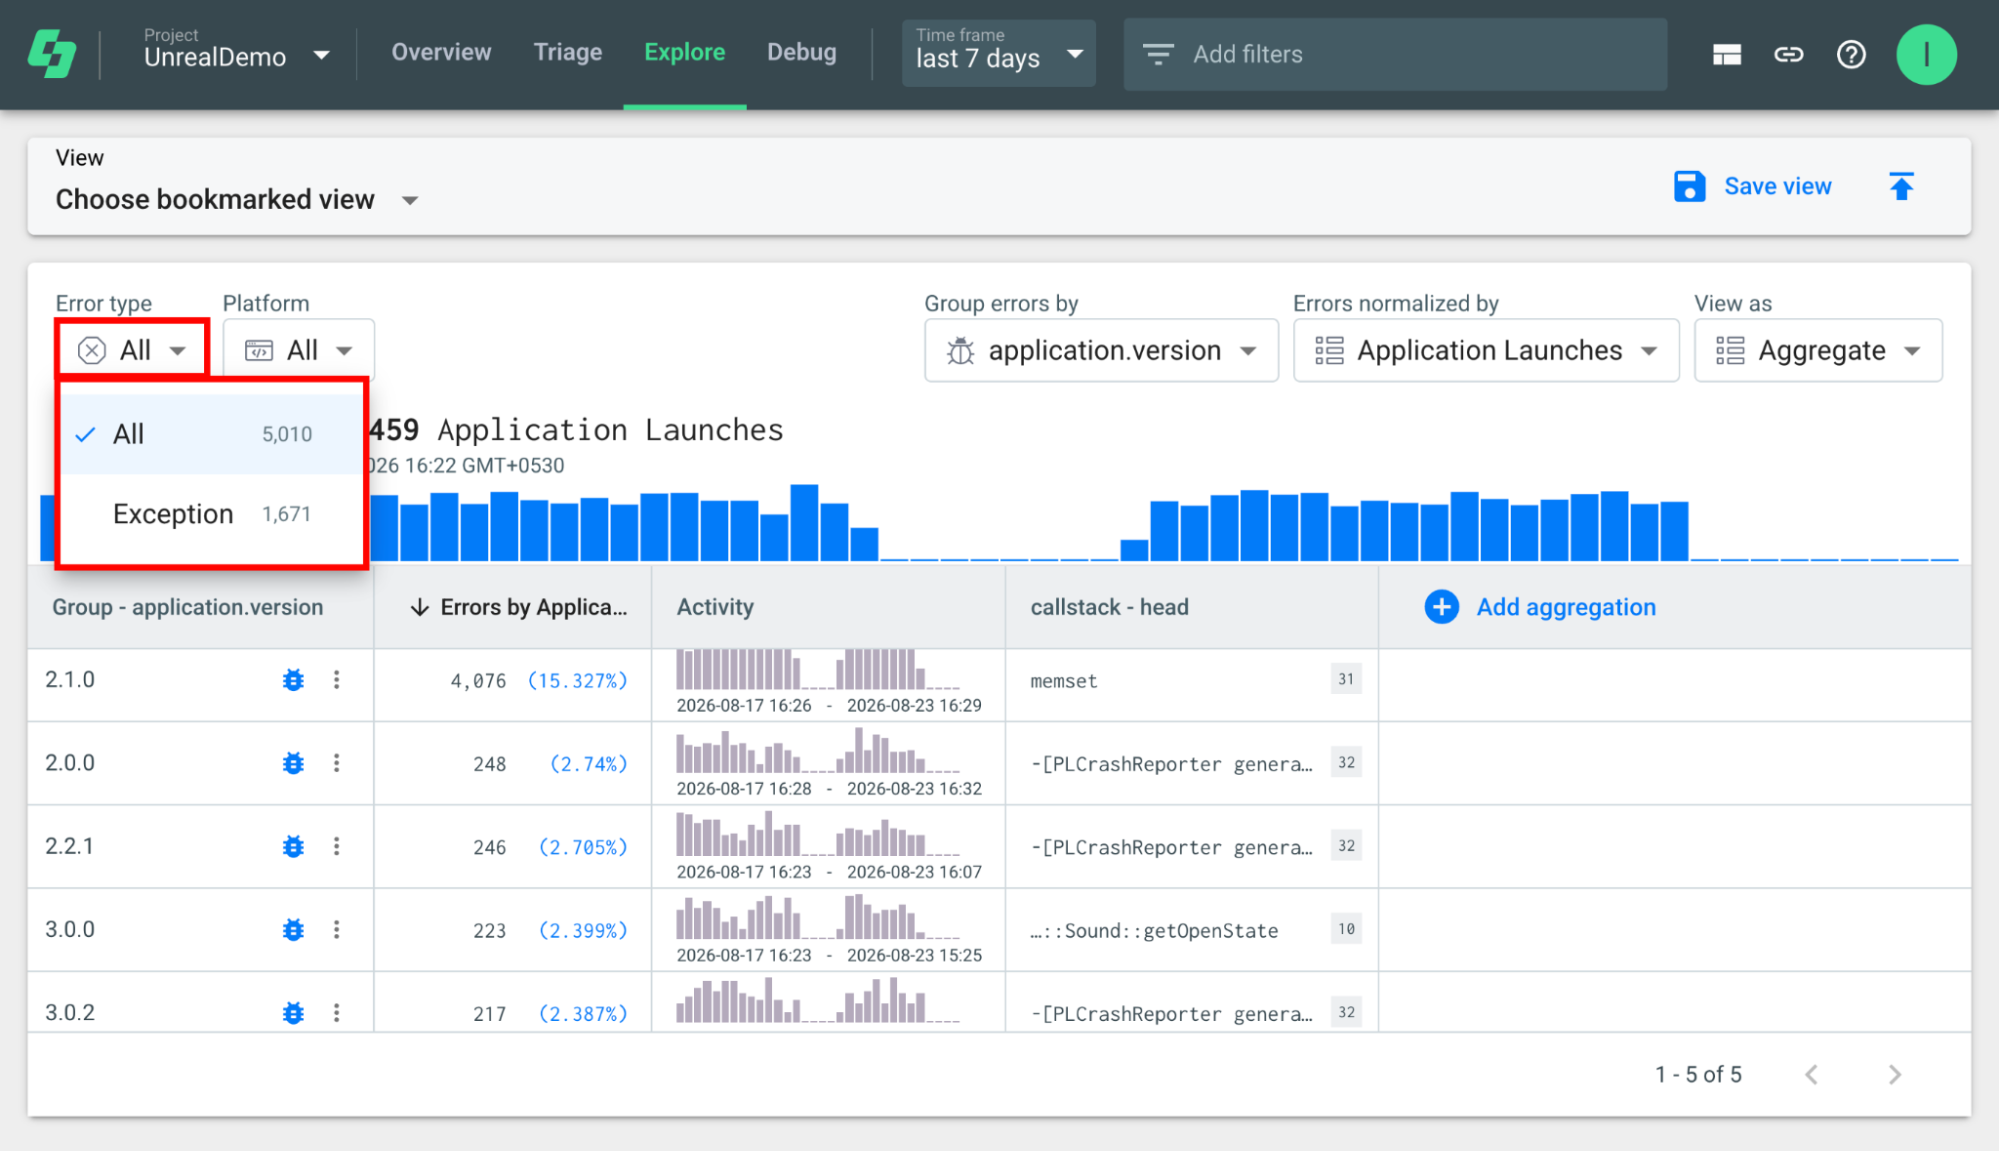
Use Error type to select the type of errors you want to analyze.
The available options depend on the error data in your project. For example, the menu can include:
-
All: Includes all available error types.
-
Exception: Displays only exception errors.
The number displayed next to each option indicates how many errors match that selection.
Platform
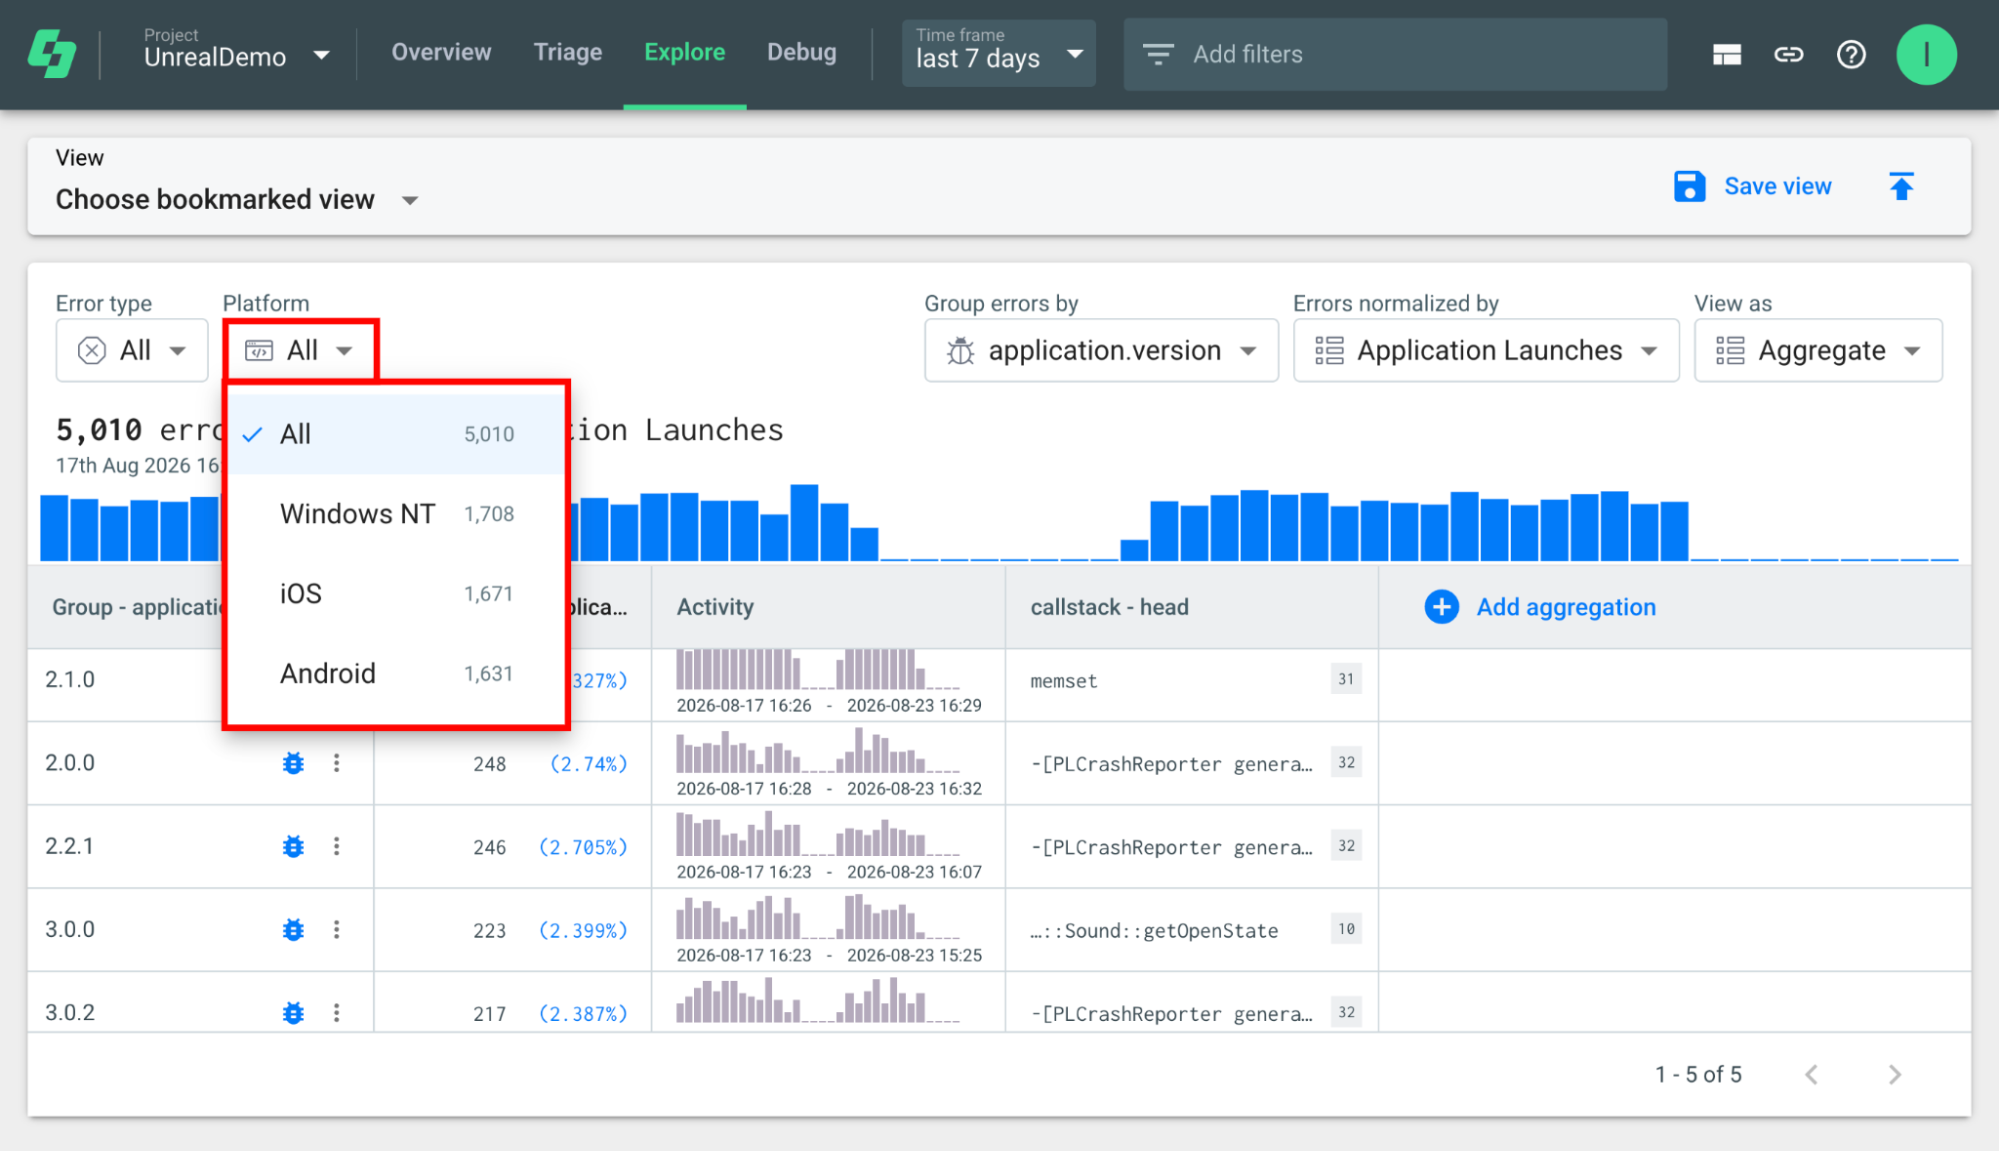
Use Platform to limit the results to a specific platform.
For example, you can select:
- All
- Windows NT
- iOS
- Android
Selecting a platform updates the Explore results to include only errors associated with that platform.
Group Errors by an Attribute
The Group errors by control determines how Explore organizes your error data. By default, errors can be grouped by fingerprint, but you can select another attribute to analyze your data from a different perspective.
Step 1: In Explore, select the current attribute under Group errors by, such as fingerprint, to open the attribute selector.
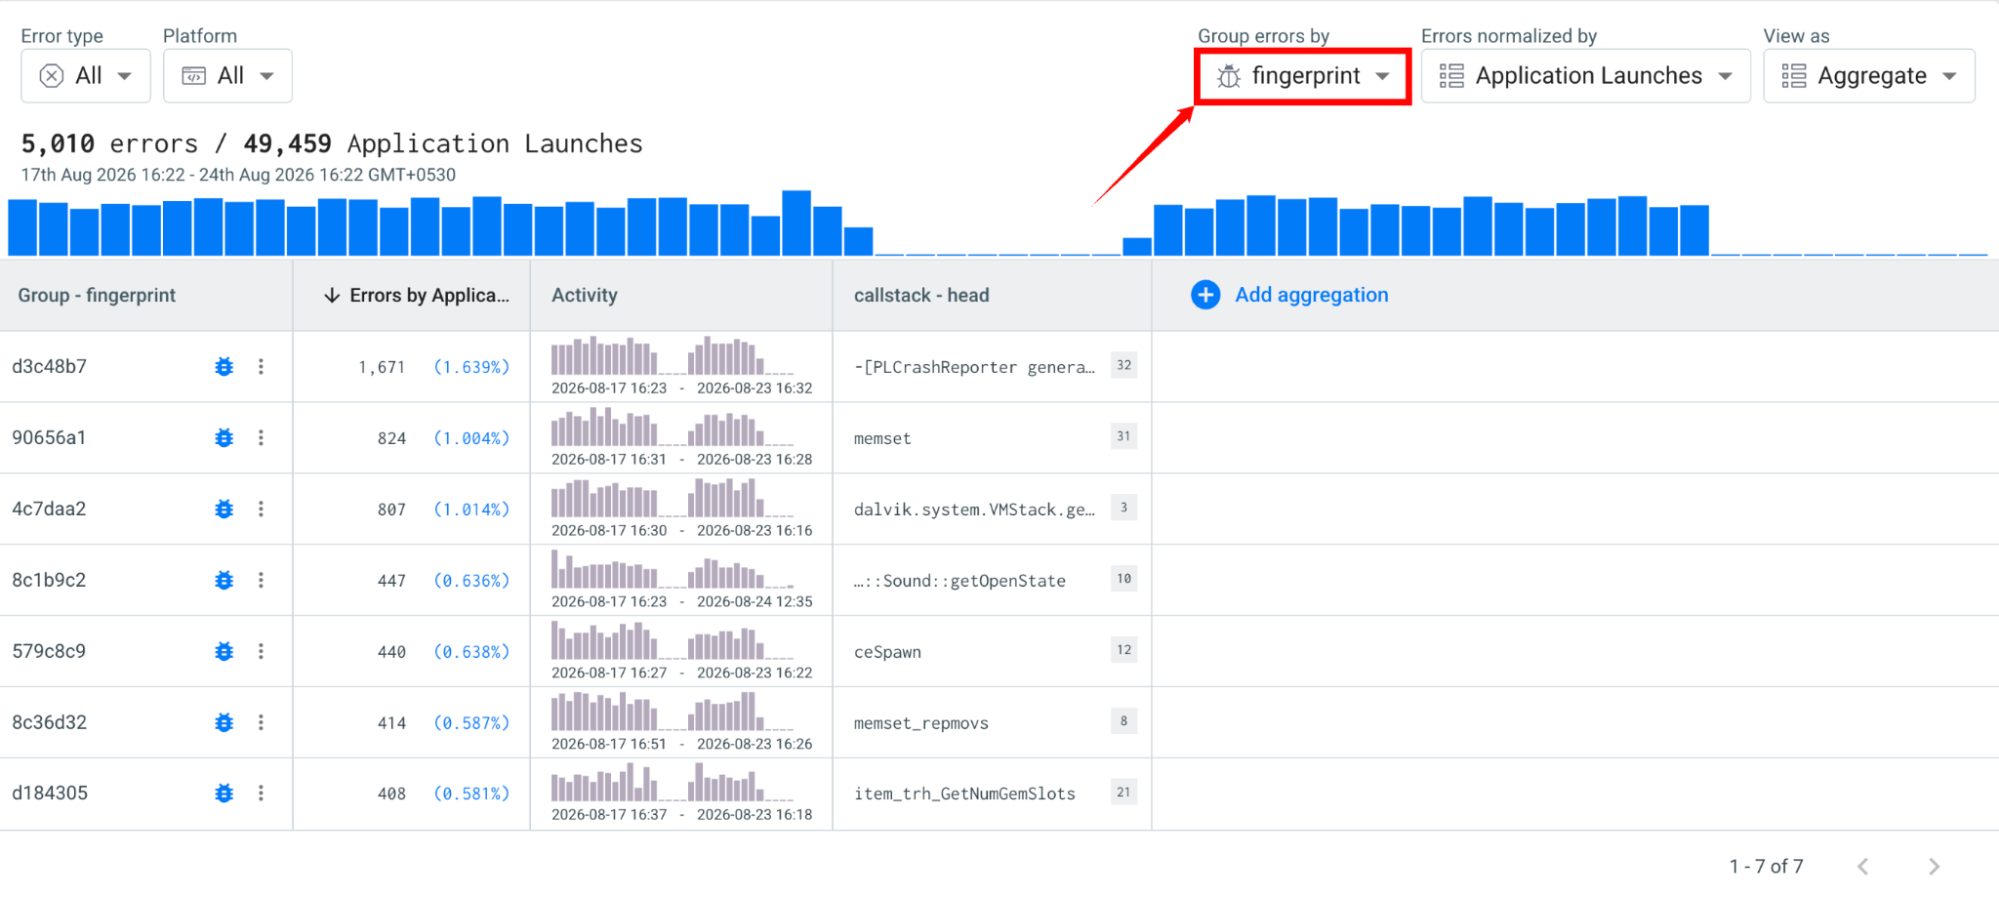
Step 2: In the attribute selector, use Search attributes to find the attribute you want to use for grouping. You can also browse the available attributes in the list.
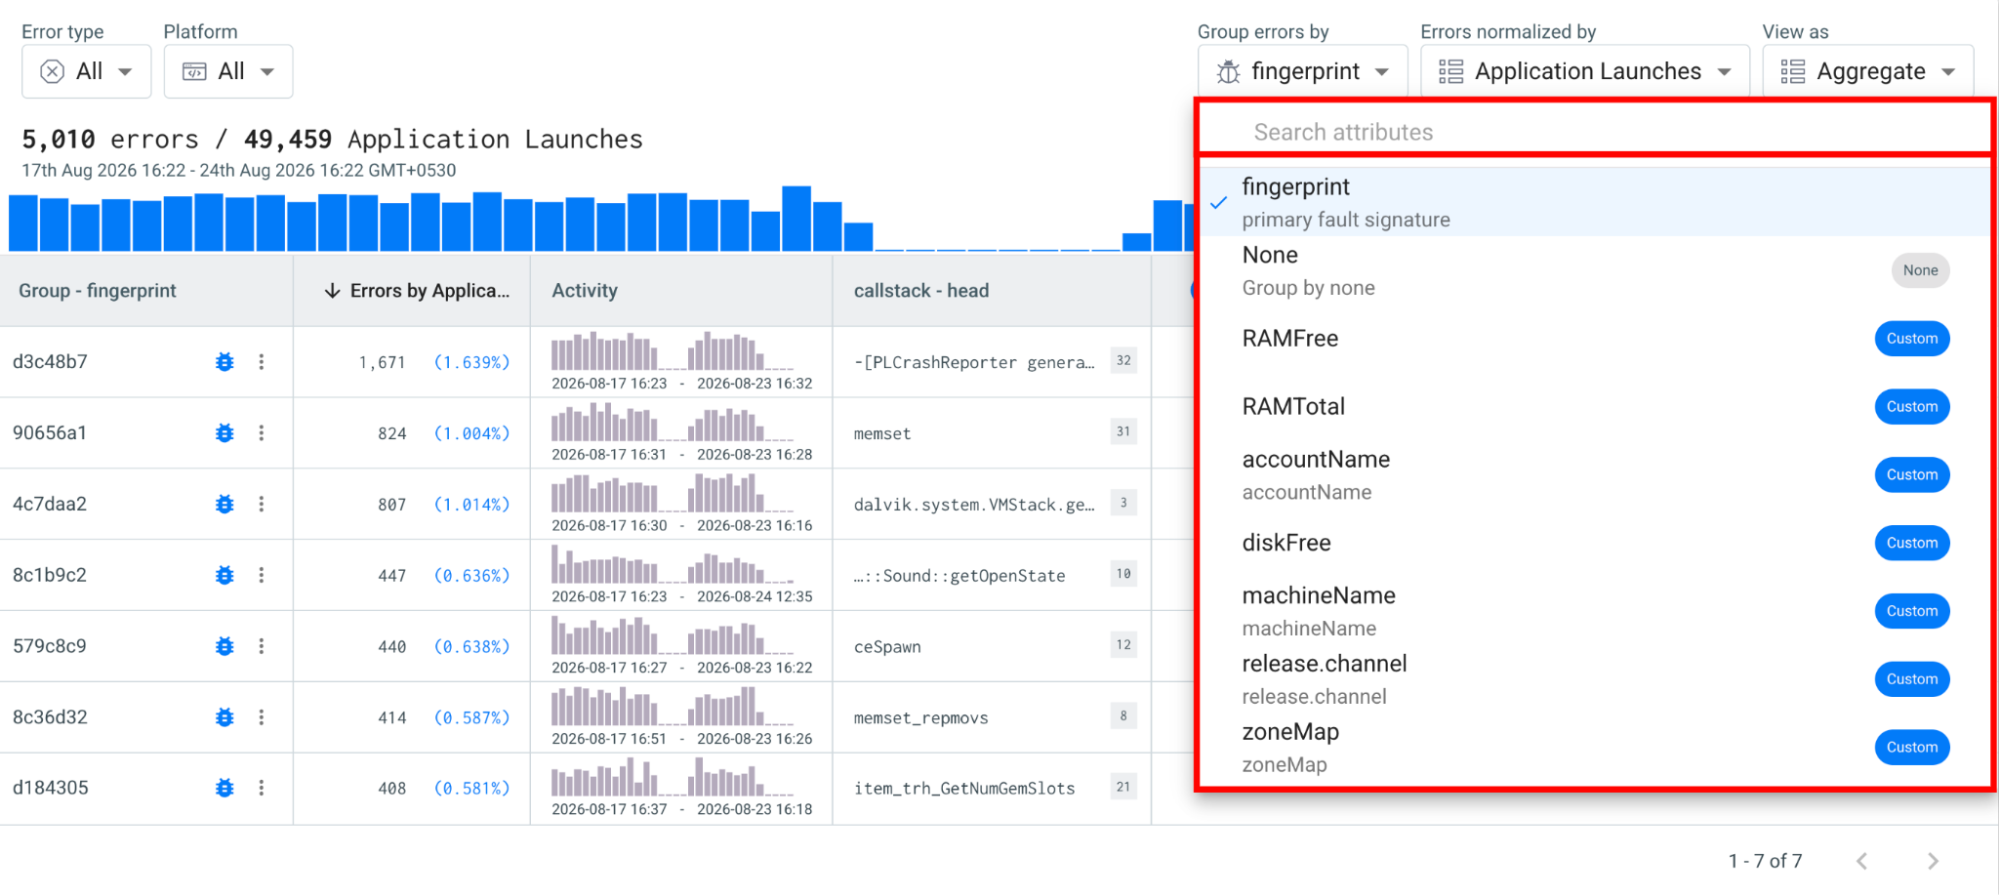
Step 3: Select the attribute you want to use. The available attributes are labeled as Default or Custom to help you identify their source.
For example, you can group errors by attributes such as accountName, machineName, release.channel, zoneMap, or RAMTotal.
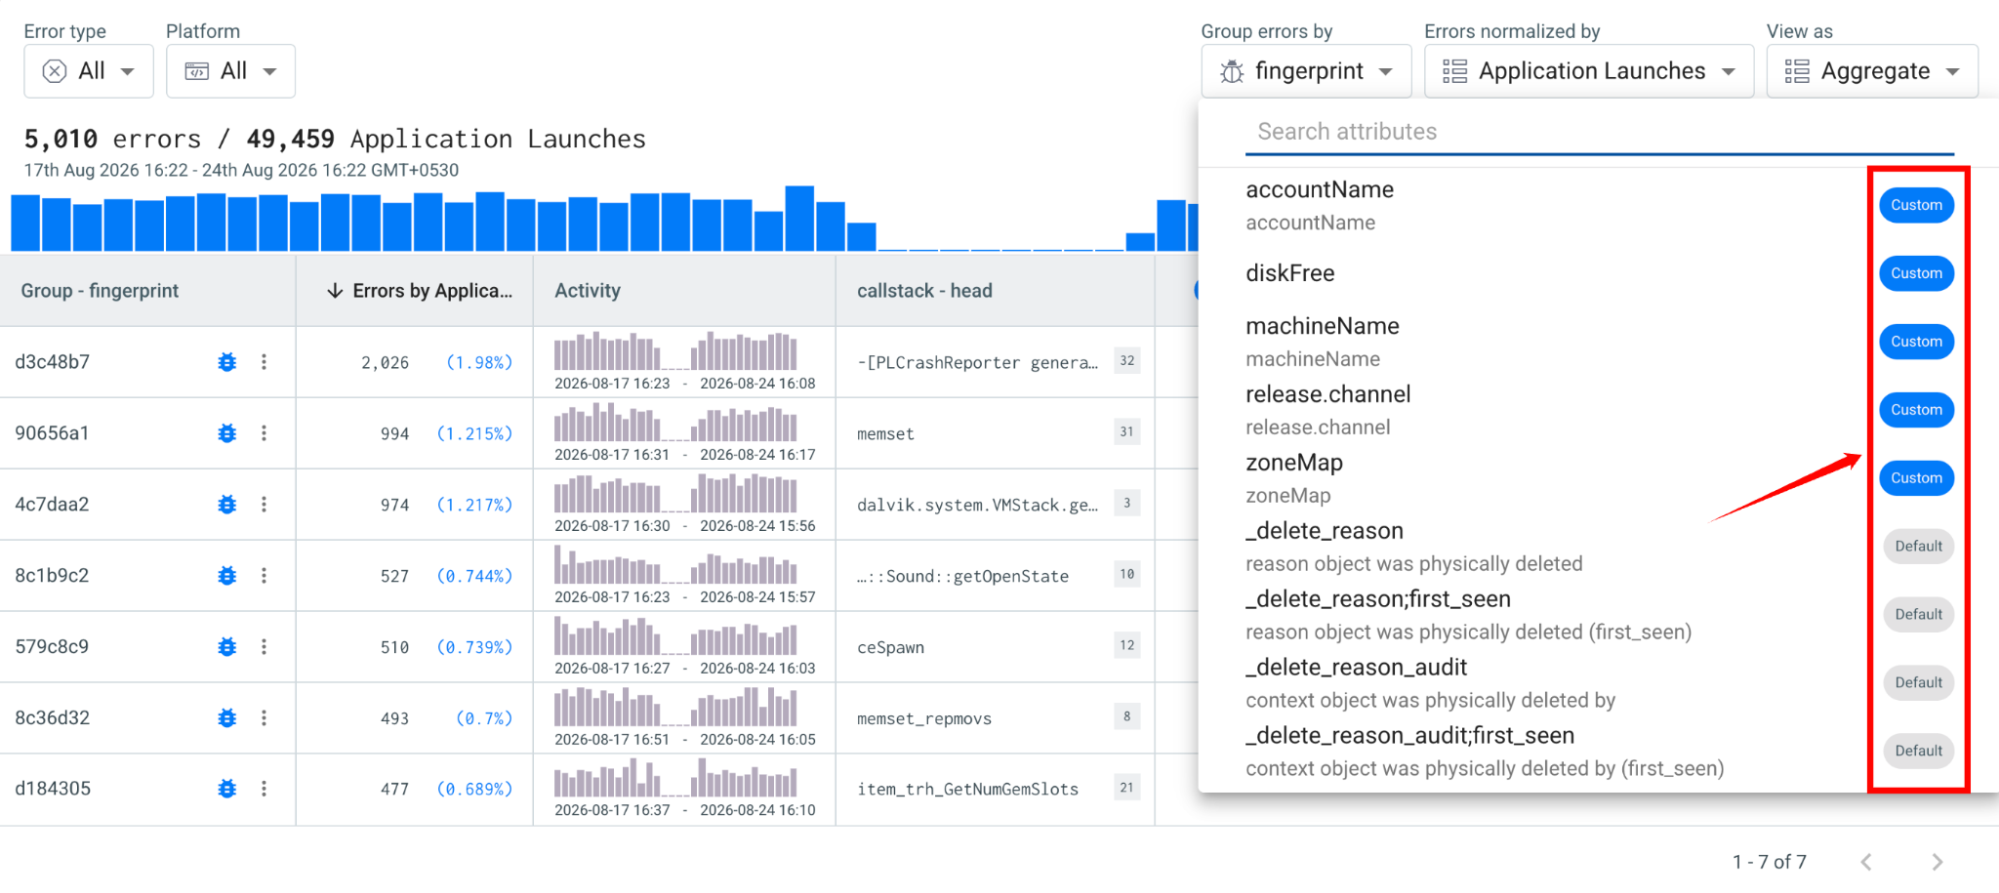
Step 4: After selecting an attribute, Explore updates the results and organizes the error data according to the selected attribute.
The attributes available in the selector depend on the data collected in your project.
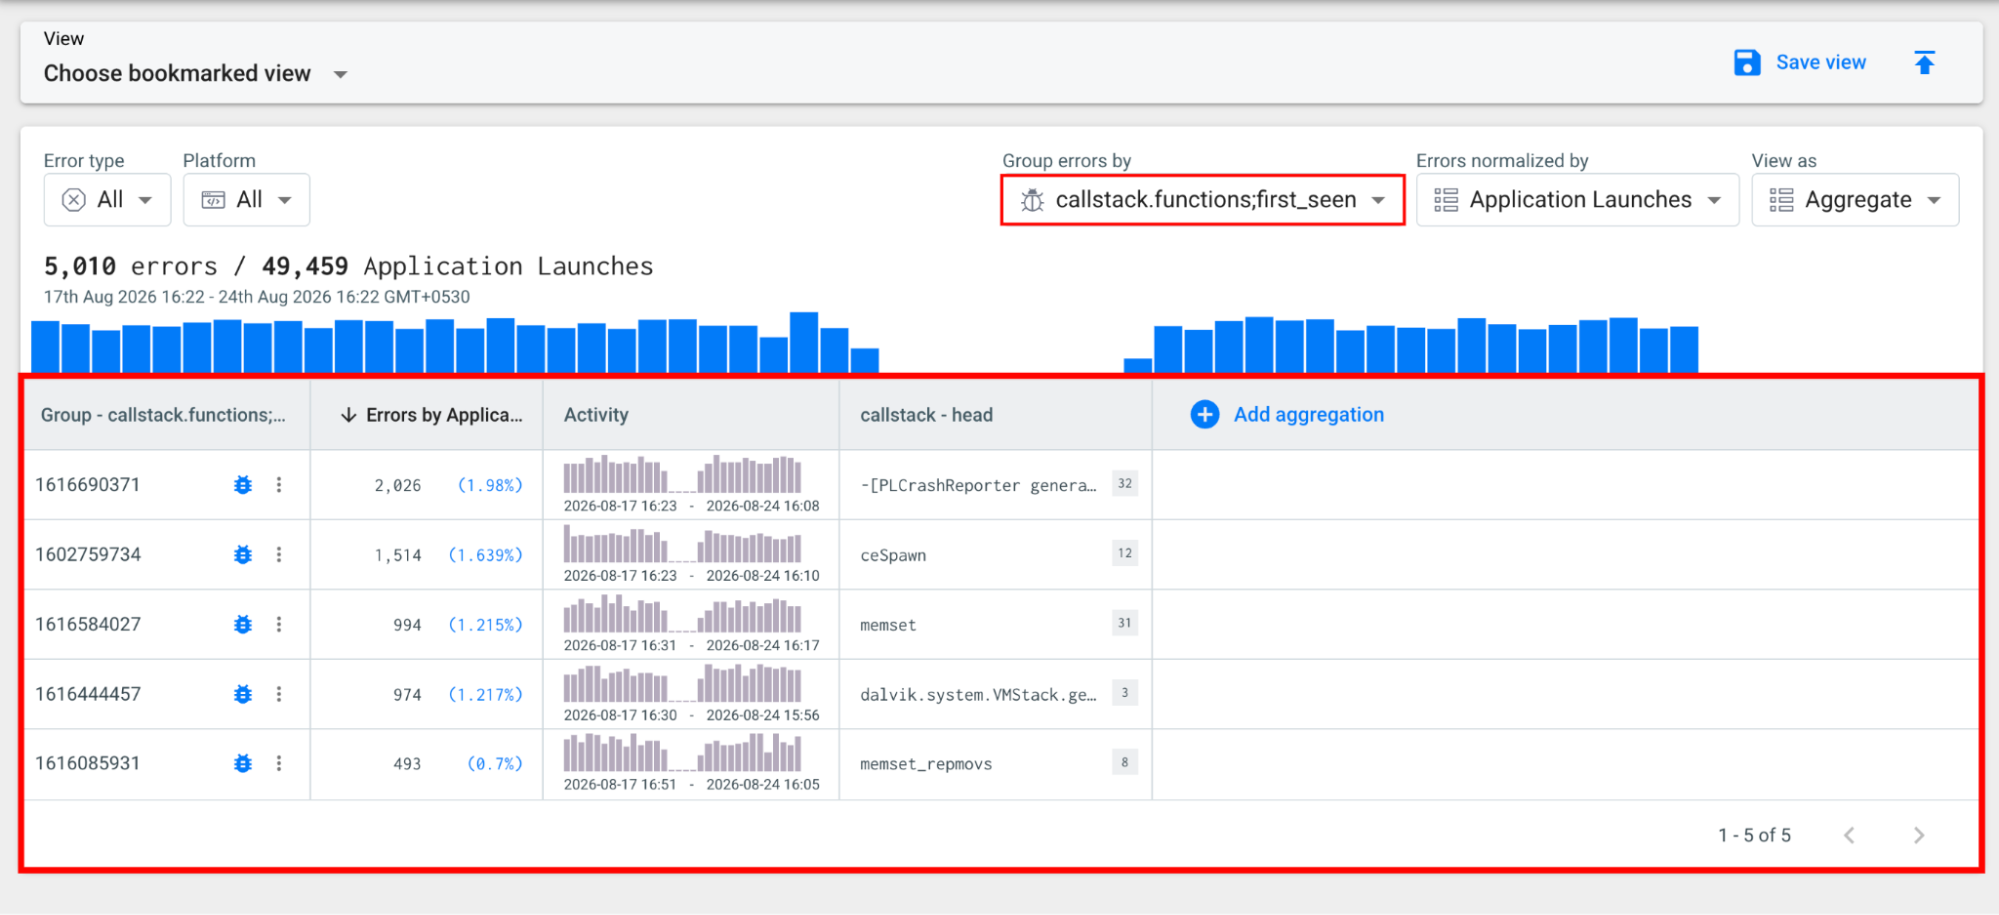
Explore Results
After you select an attribute under Group errors by, Explore displays the matching error data in a table. The columns provide a summary of each group and help you understand error frequency and activity.
| Ref. | Column | Description |
|---|---|---|
| 1 | Group - fingerprint | Displays the fingerprint value for each error group. The column name changes based on the attribute selected under Group errors by. |
| 2 | Errors by Application Launches | Displays the number of errors for each group and the percentage of errors relative to the selected Application Launches metric. The column name changes based on the metric selected under Errors normalized by. |
| 3 | Activity | Displays a timeline of error activity for each group over the selected time frame. |
| 4 | Add aggregation | Allows you to add additional aggregation columns to analyze more information for each error group. |
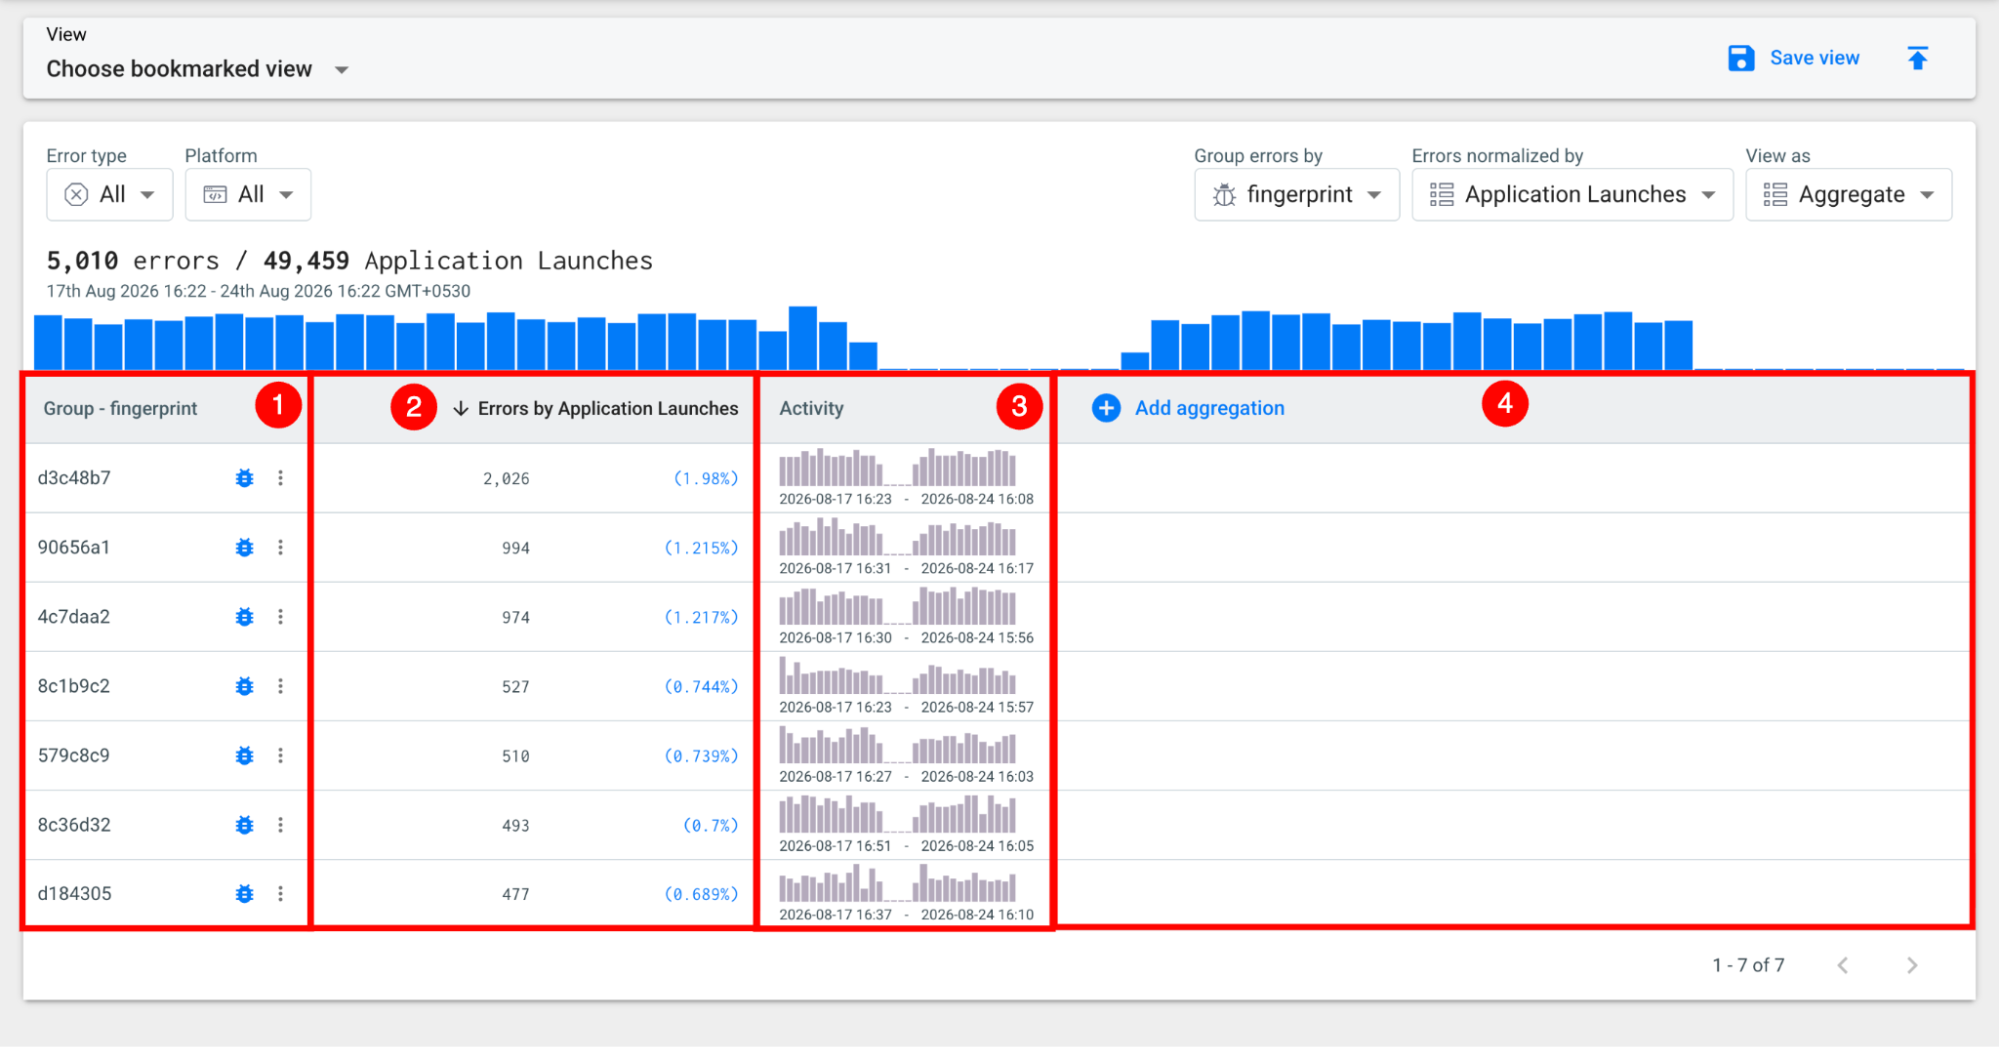
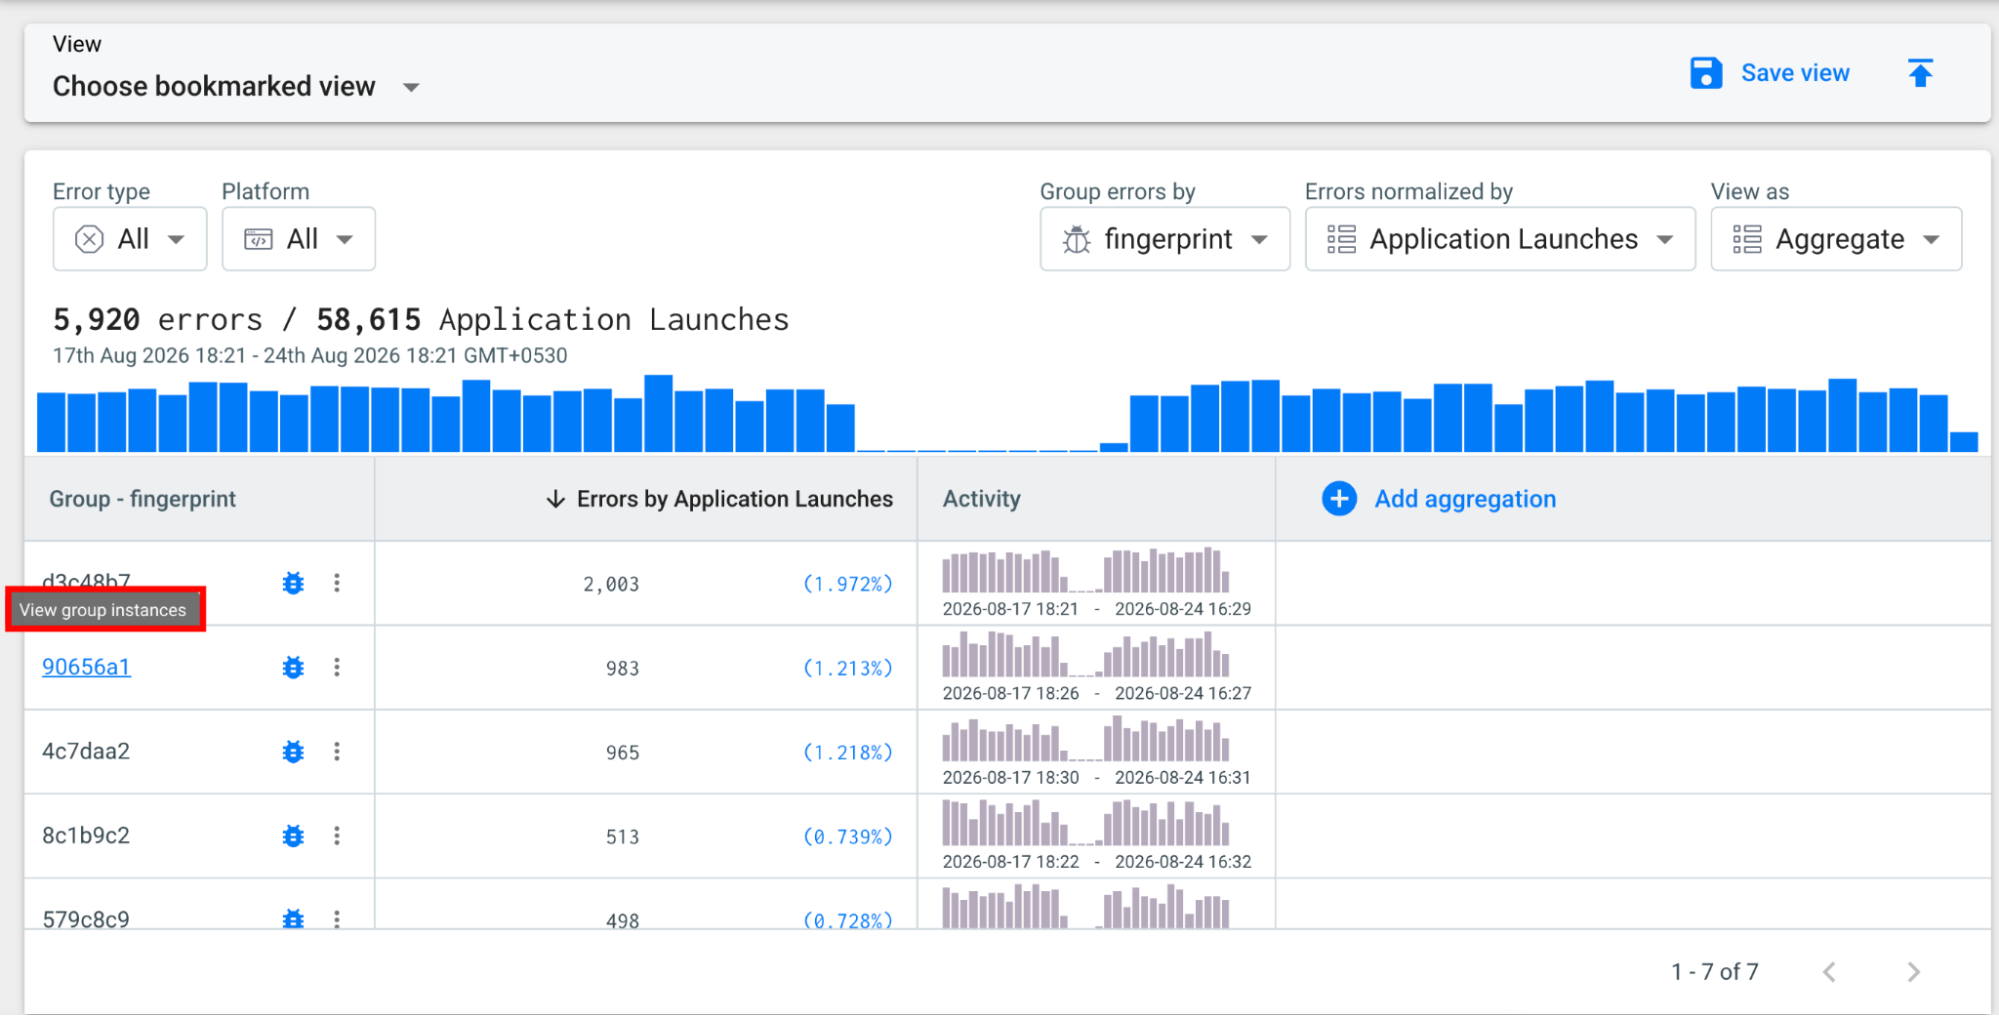
For example, in the screenshot, errors are grouped by fingerprint and normalized by Application Launches. The first row shows fingerprint d3c48b7 with 2,026 errors, representing 1.98% of the selected application launches.
To add more metrics or attributes to the results, select Add aggregation. For more information, see Add Custom Aggregations.
View Group Instances
The Aggregate view provides a summarized view of your error data by grouping errors according to the attribute selected under Group errors by. When you want to investigate a specific group in more detail, you can open the group to view the individual error instances associated with it.
Step 1: In the Aggregate view, review the groups listed in the Group column and identify the group you want to investigate further.
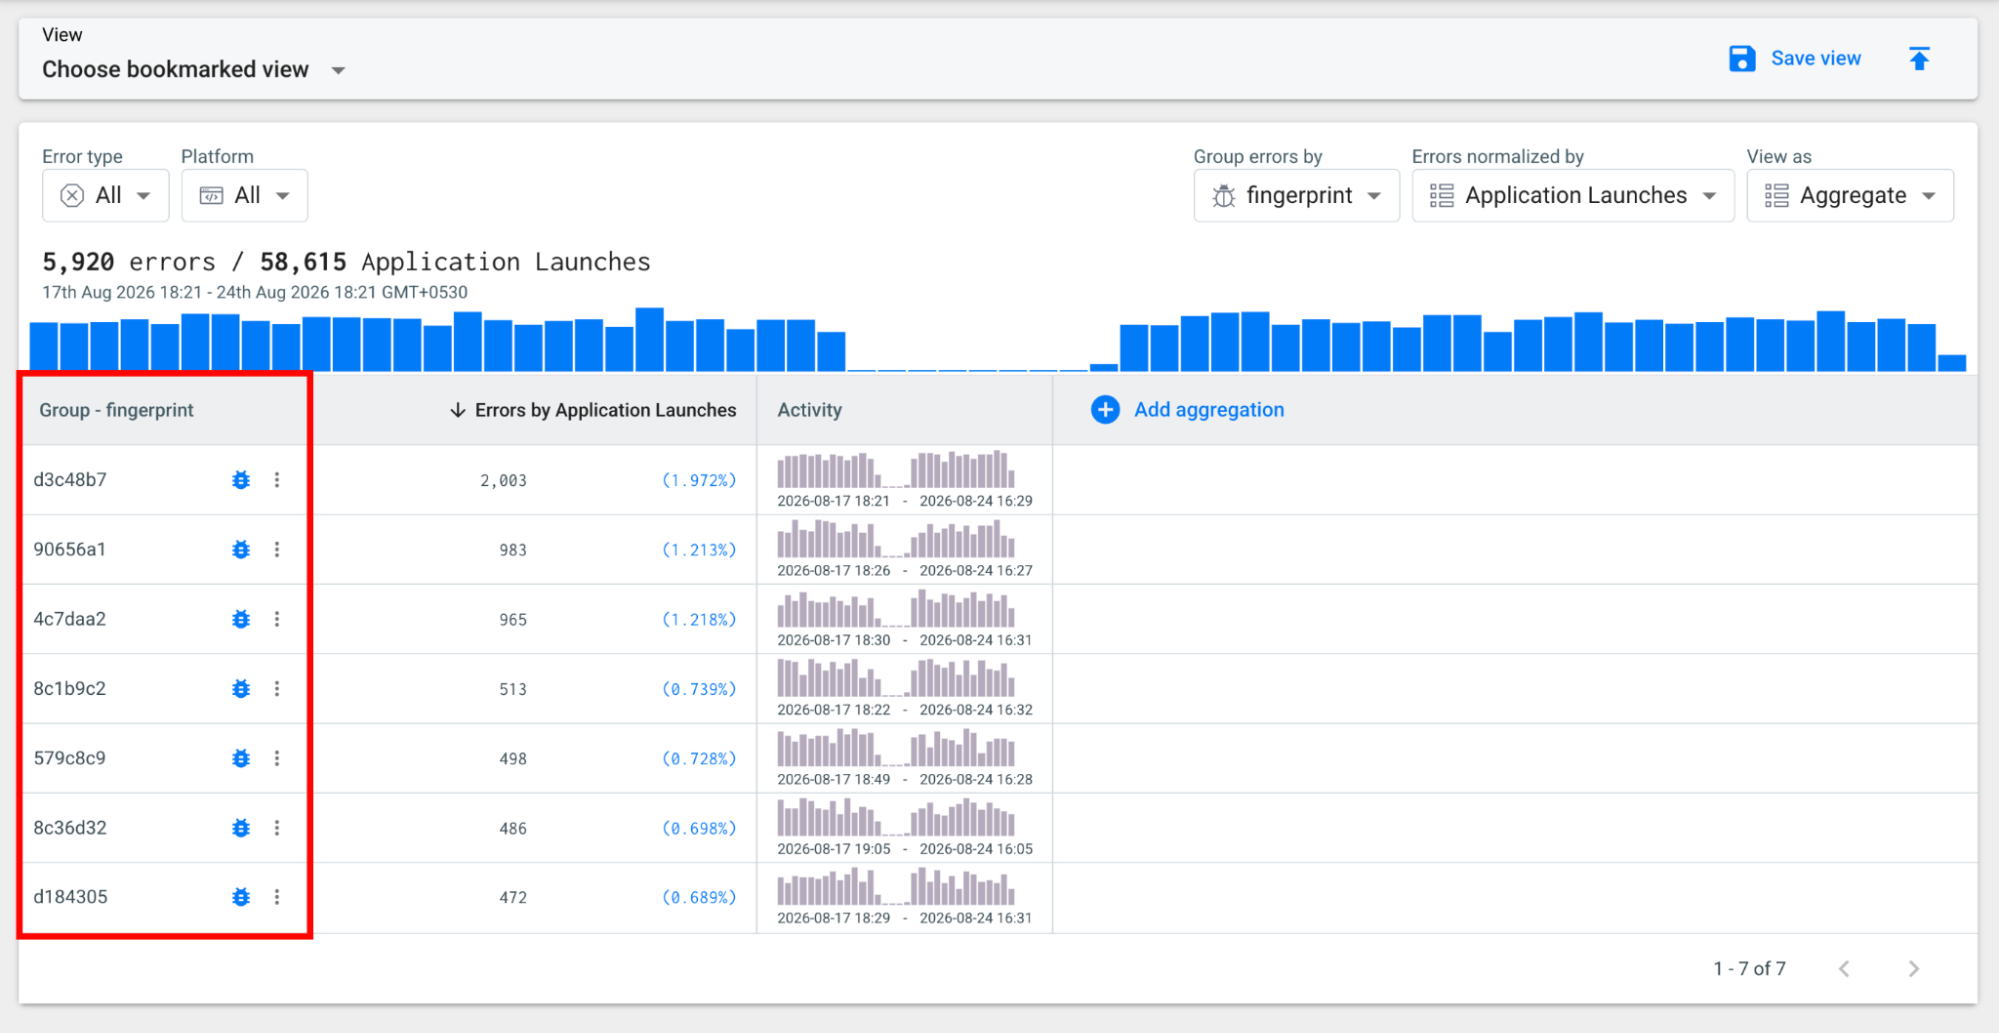
Step 2: Hover over the group icon next to the group value. The “View group instances” tooltip appears, indicating that you can open the individual instances for that group. Click on the group icon.
Step 3: Explore opens the List view and automatically applies a filter for the selected group. The filter appears at the top of the page, showing the attribute and value used to identify the group.
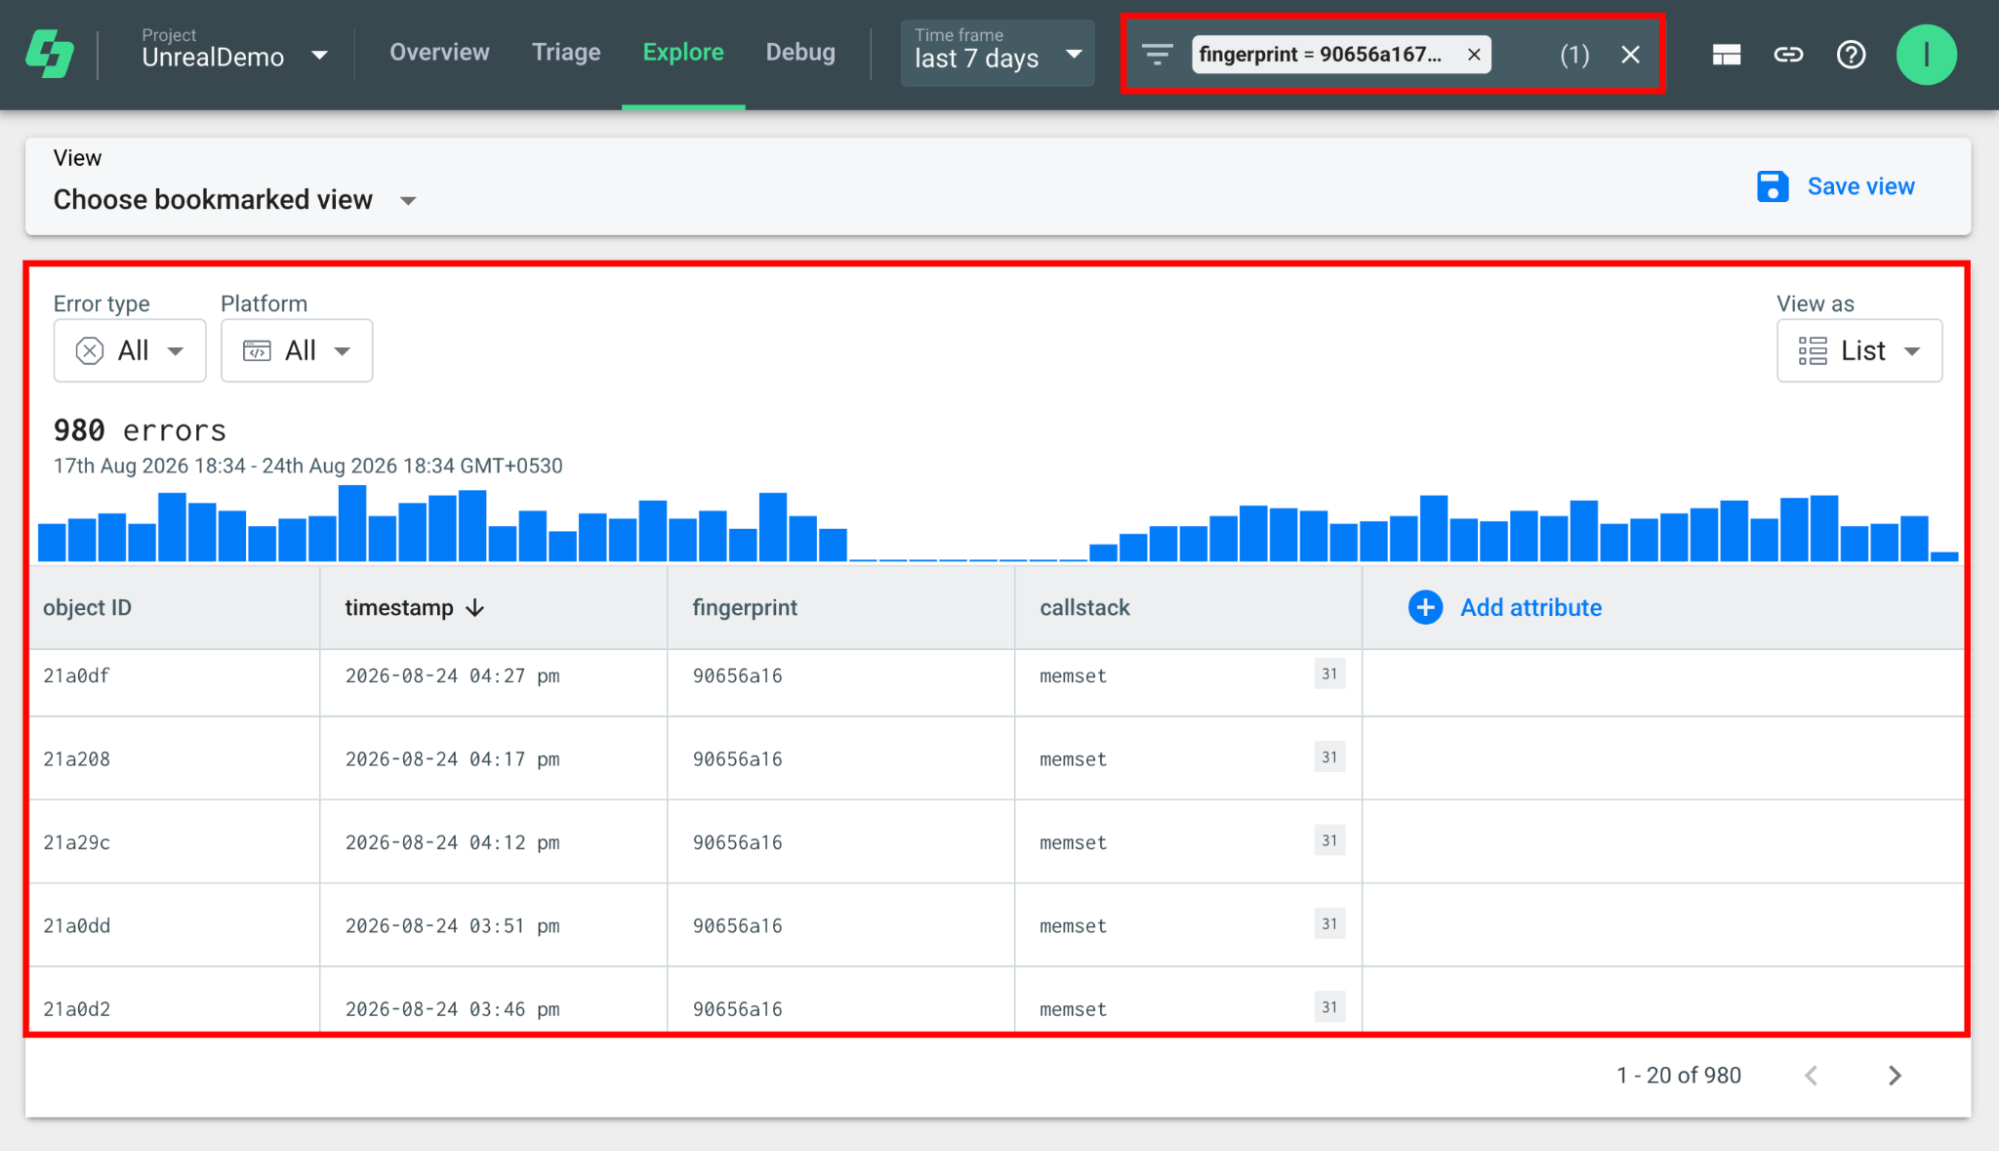
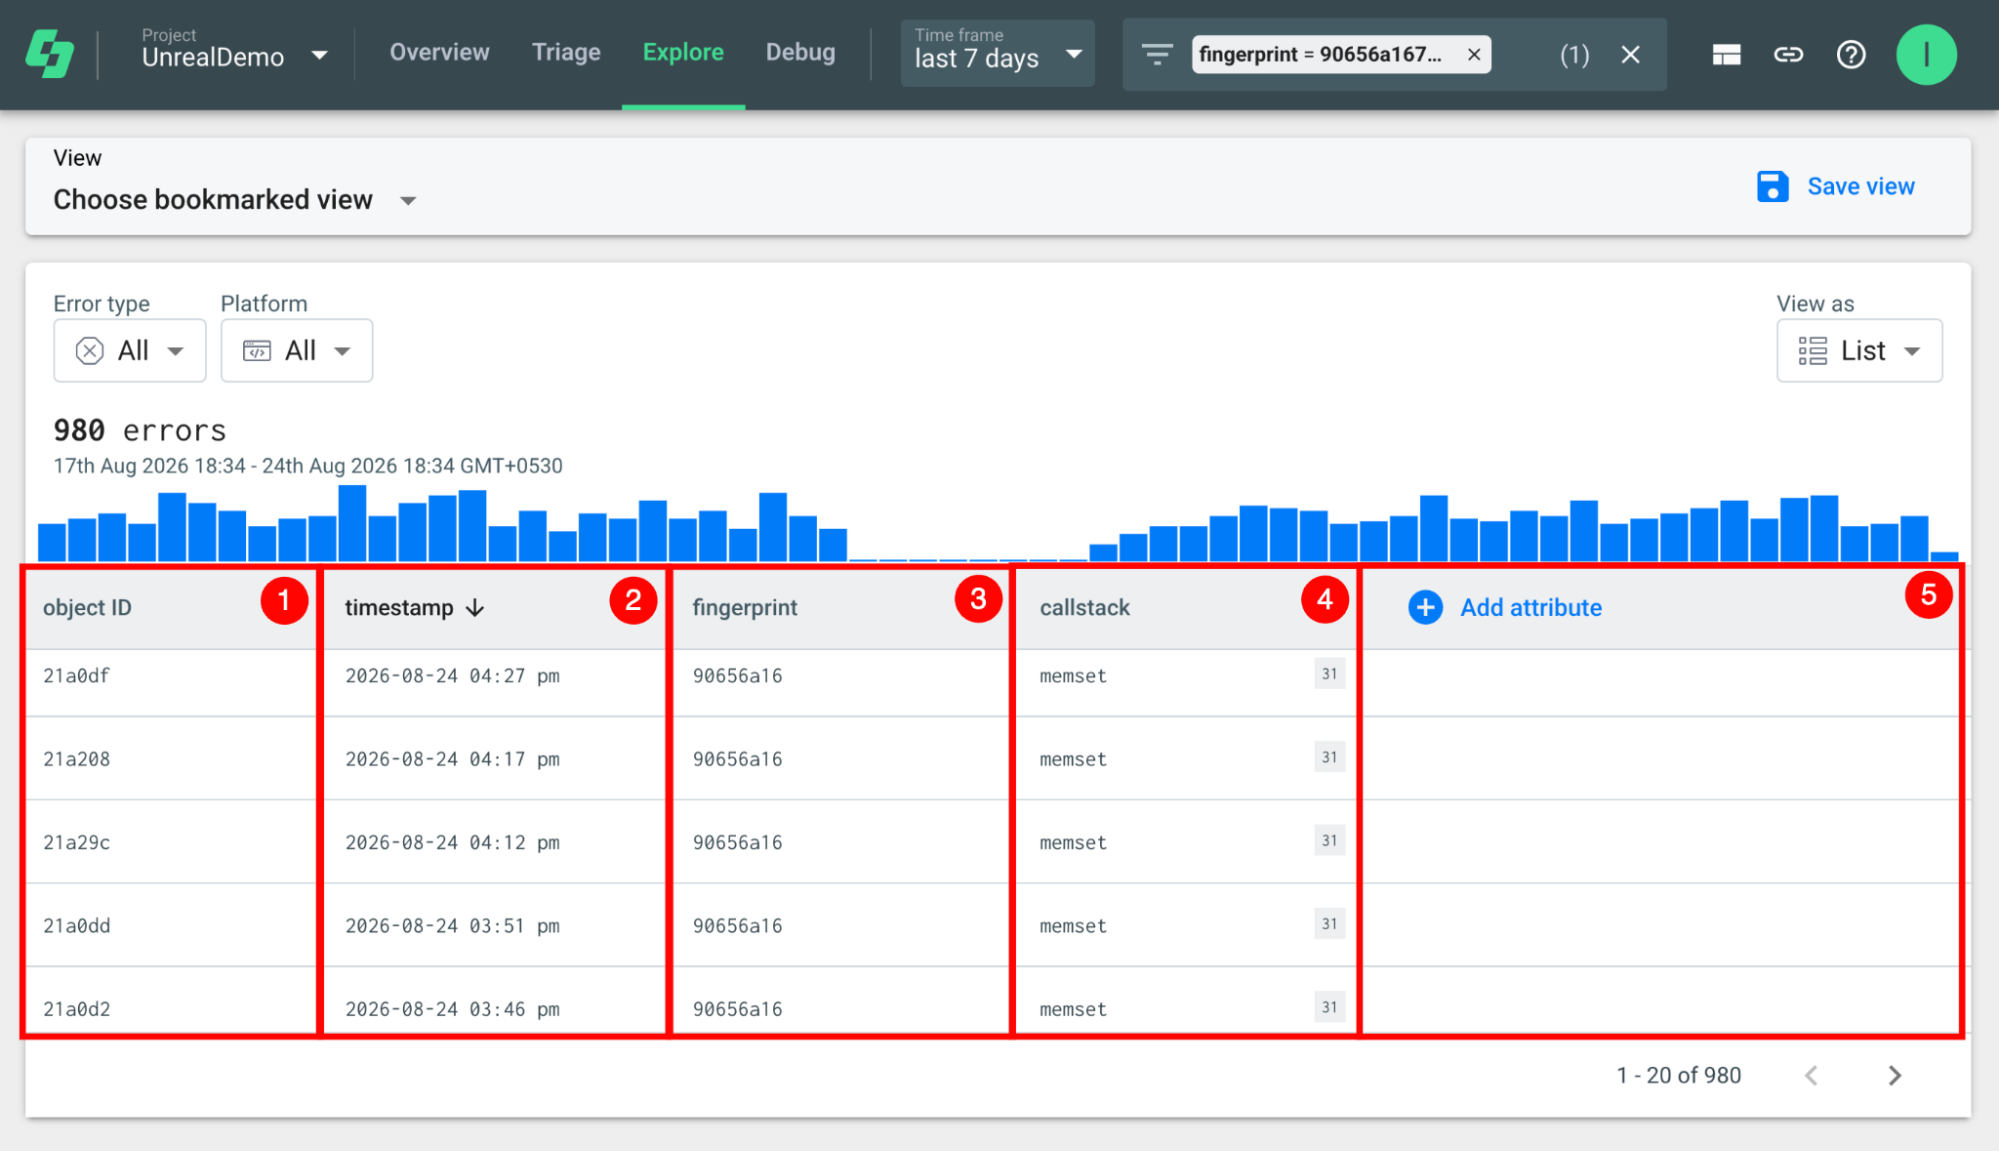
Step 4: Review the individual error instances in the list. The available columns include:
| Ref. | Column | Description |
|---|---|---|
| 1 | Object ID | Identifies the individual error instance and provides a unique reference for that specific error occurrence. |
| 2 | Timestamp | Shows the date and time when the individual error instance was recorded, helping you understand when the error occurred within the selected time frame. |
| 3 | Fingerprint | Identifies the fingerprint associated with the error instance. Related error instances can share the same fingerprint. |
| 4 | Callstack | Displays the callstack associated with the error instance, helping you understand the code path where the error occurred. |
| 5 | Add attribute | Allows you to add additional attributes to the List view. Select Add attribute to choose attributes from the available list and display additional information for each error instance. |
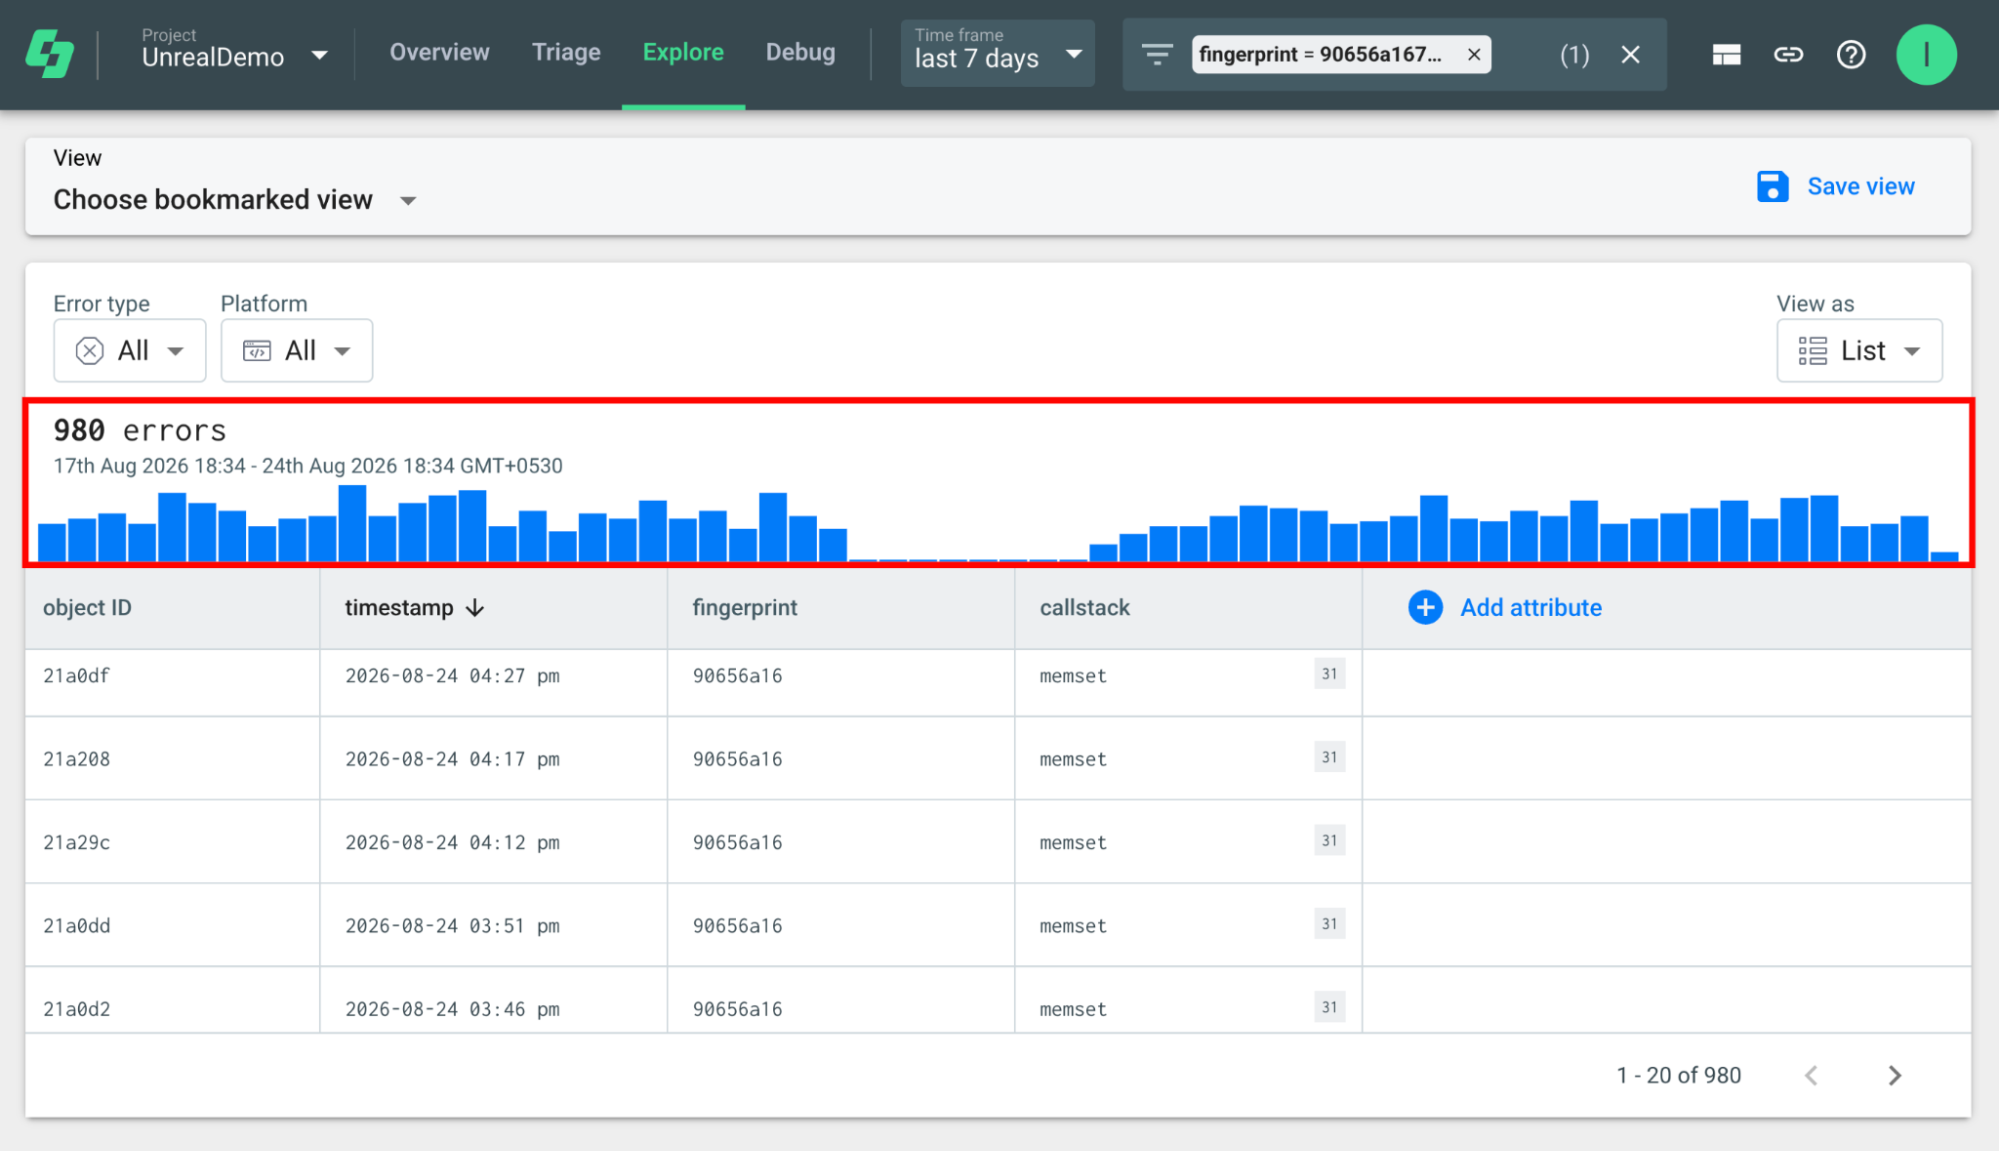
The List view also displays the total number of matching errors and the current time frame. You can use the results to examine individual instances within the selected group and investigate the details of the errors.
The List view is filtered to the selected group. To return to the broader Explore results, remove the group filter from the filter bar.
Delete a Column
You can remove a column from the Aggregate view when you no longer need the information it displays. This helps keep the results focused on the attributes and metrics relevant to your analysis.
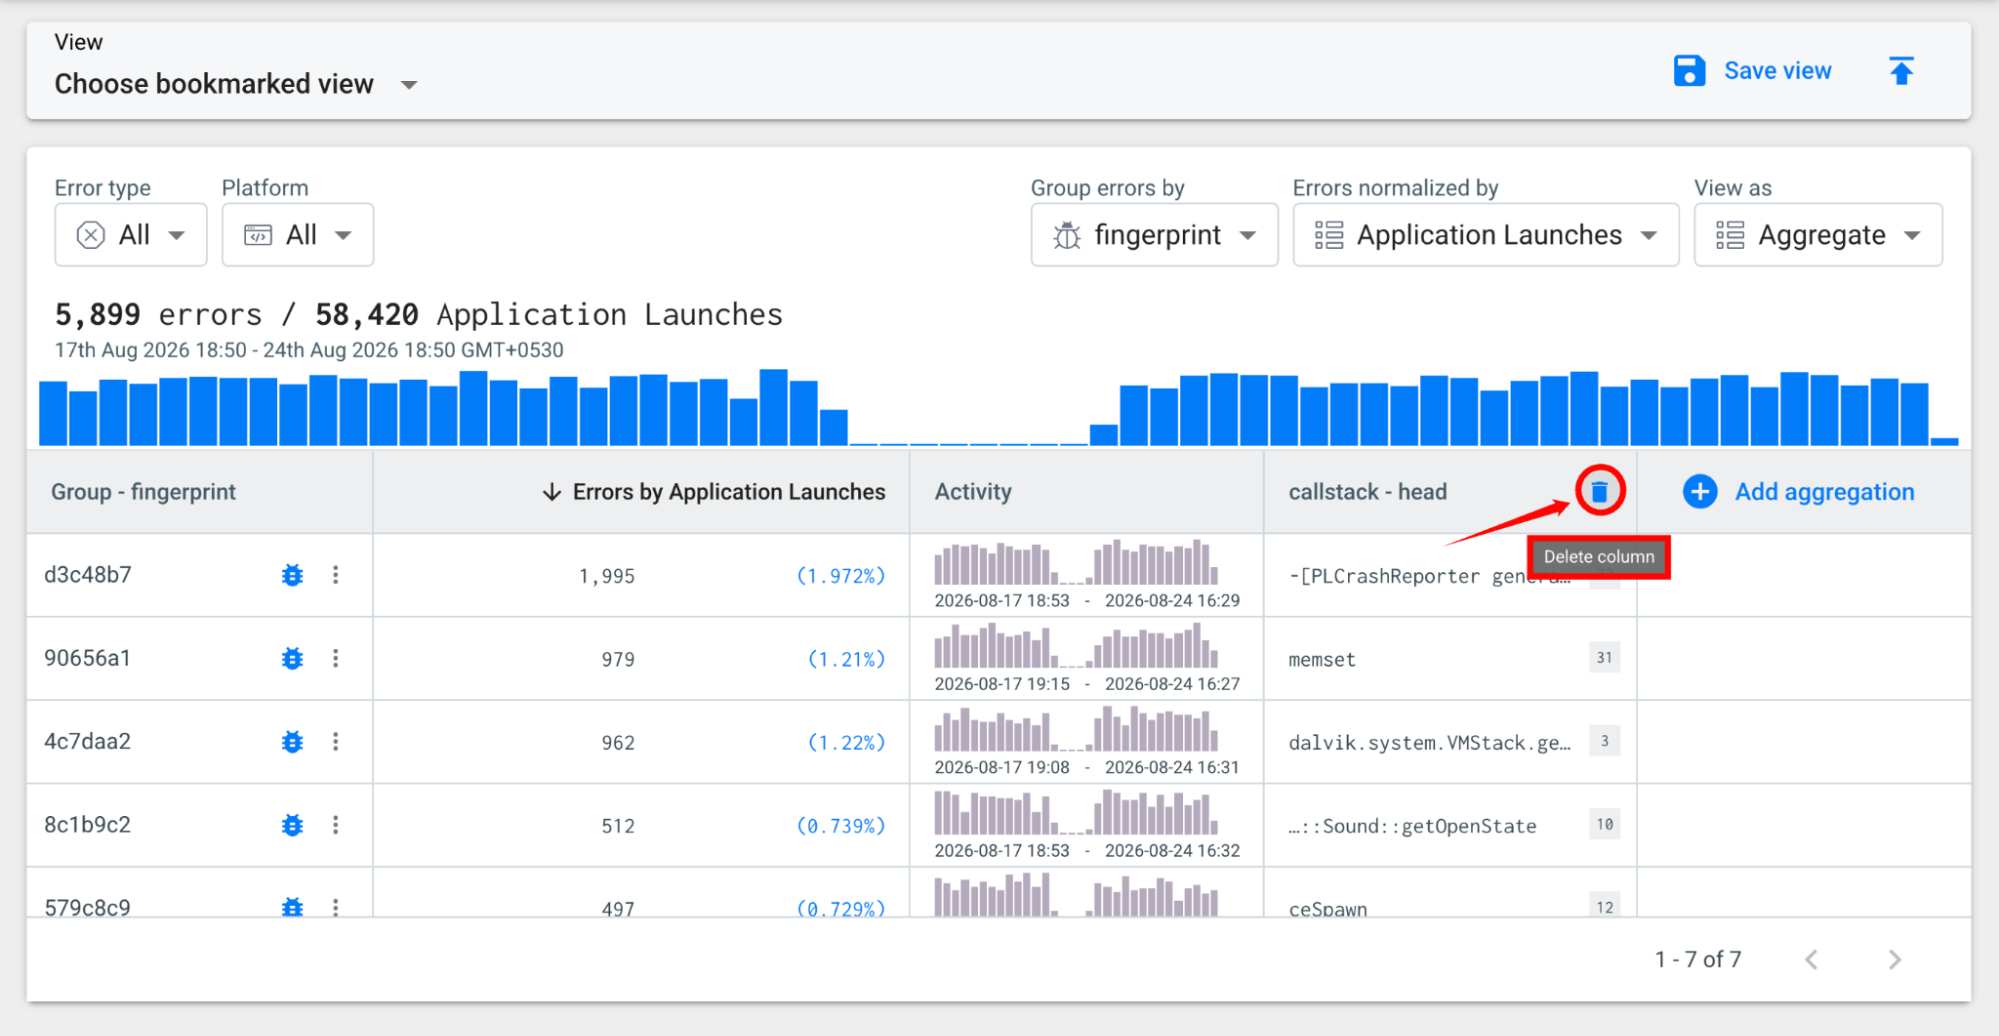
Hover over the column header to display the Delete column option. The tooltip indicates that the selected column can be removed from the view.
Select the Delete column icon to remove the column from the results. The remaining columns and grouped error data stay available in the Aggregate view.
View in Debugger
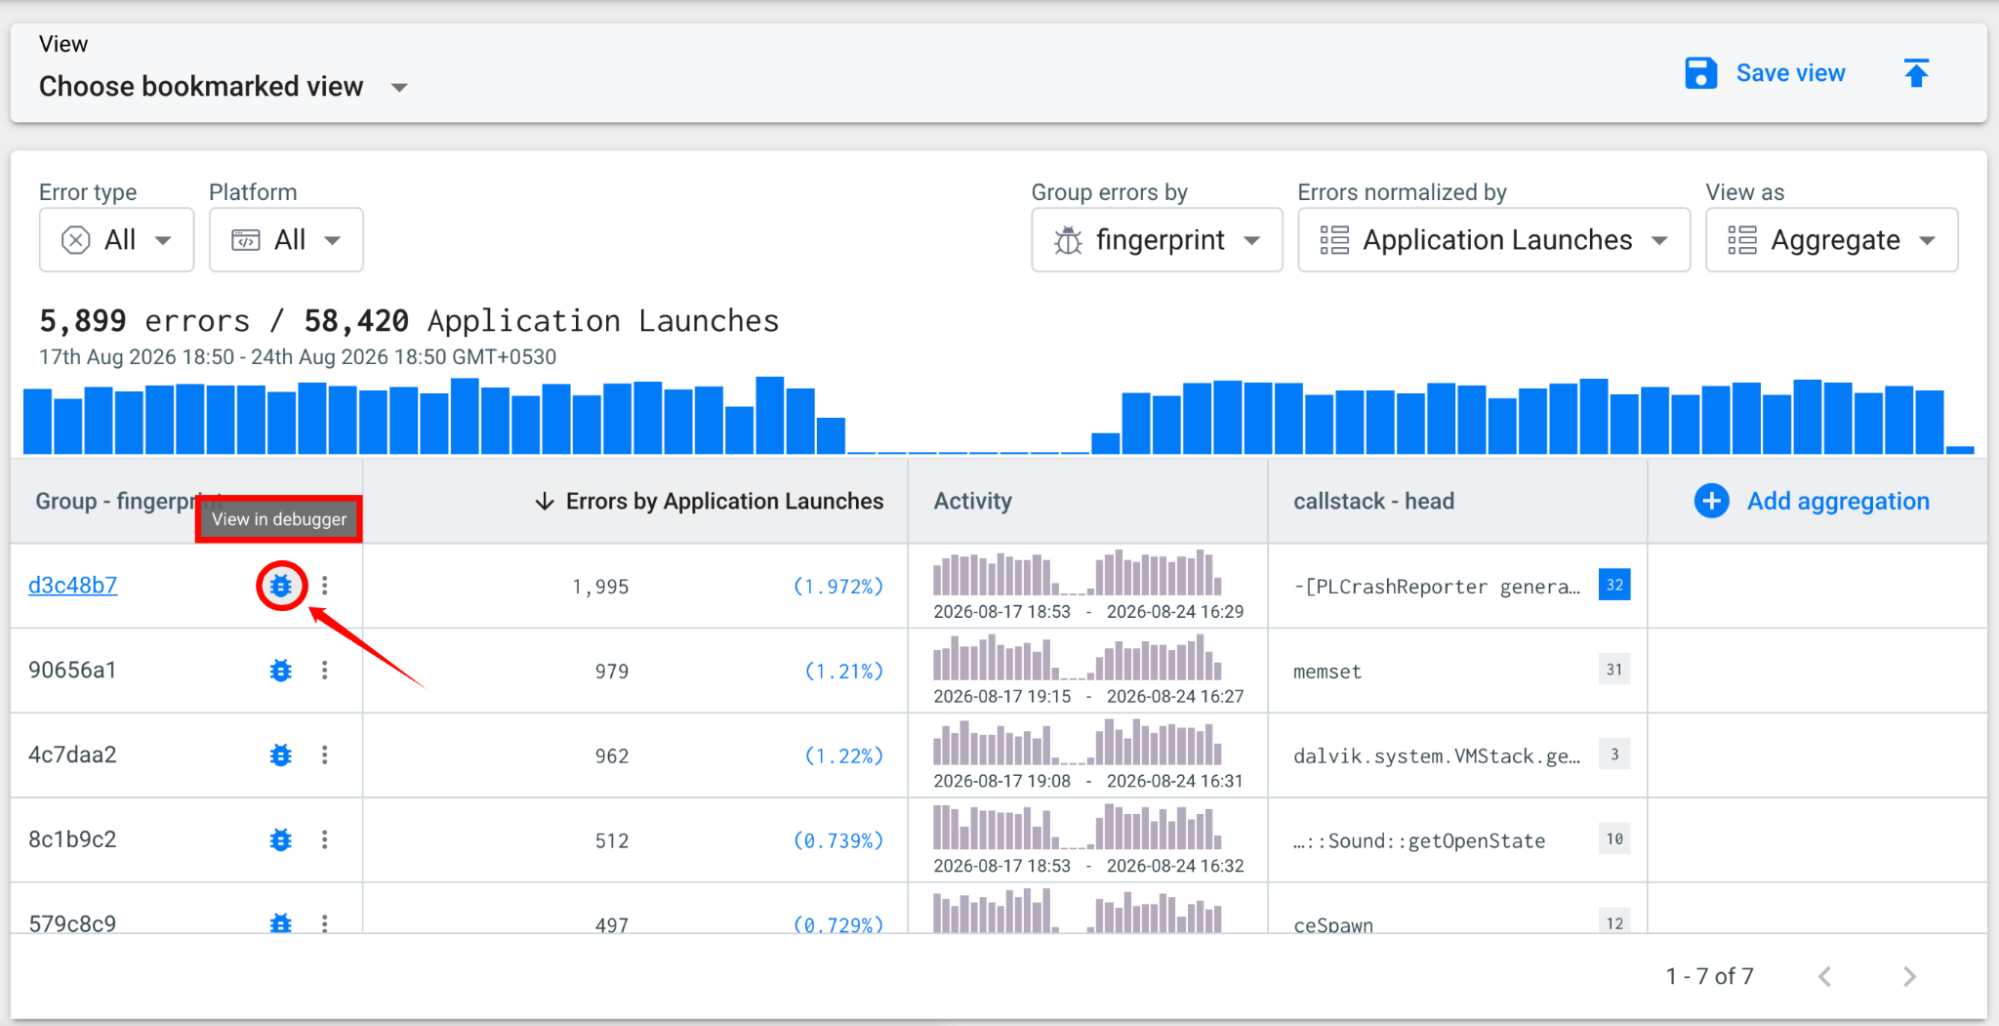
The View in Debugger option lets you open an error group in the debugger for further investigation. This provides a more detailed view of the selected error and its associated debugging information.
Hover over the debugger icon next to a group to display the “View in debugger” tooltip. Select the debugger icon to open the selected error group in the debugger. This option is available when you need to investigate an error beyond the information available in the Aggregate view.
More Options
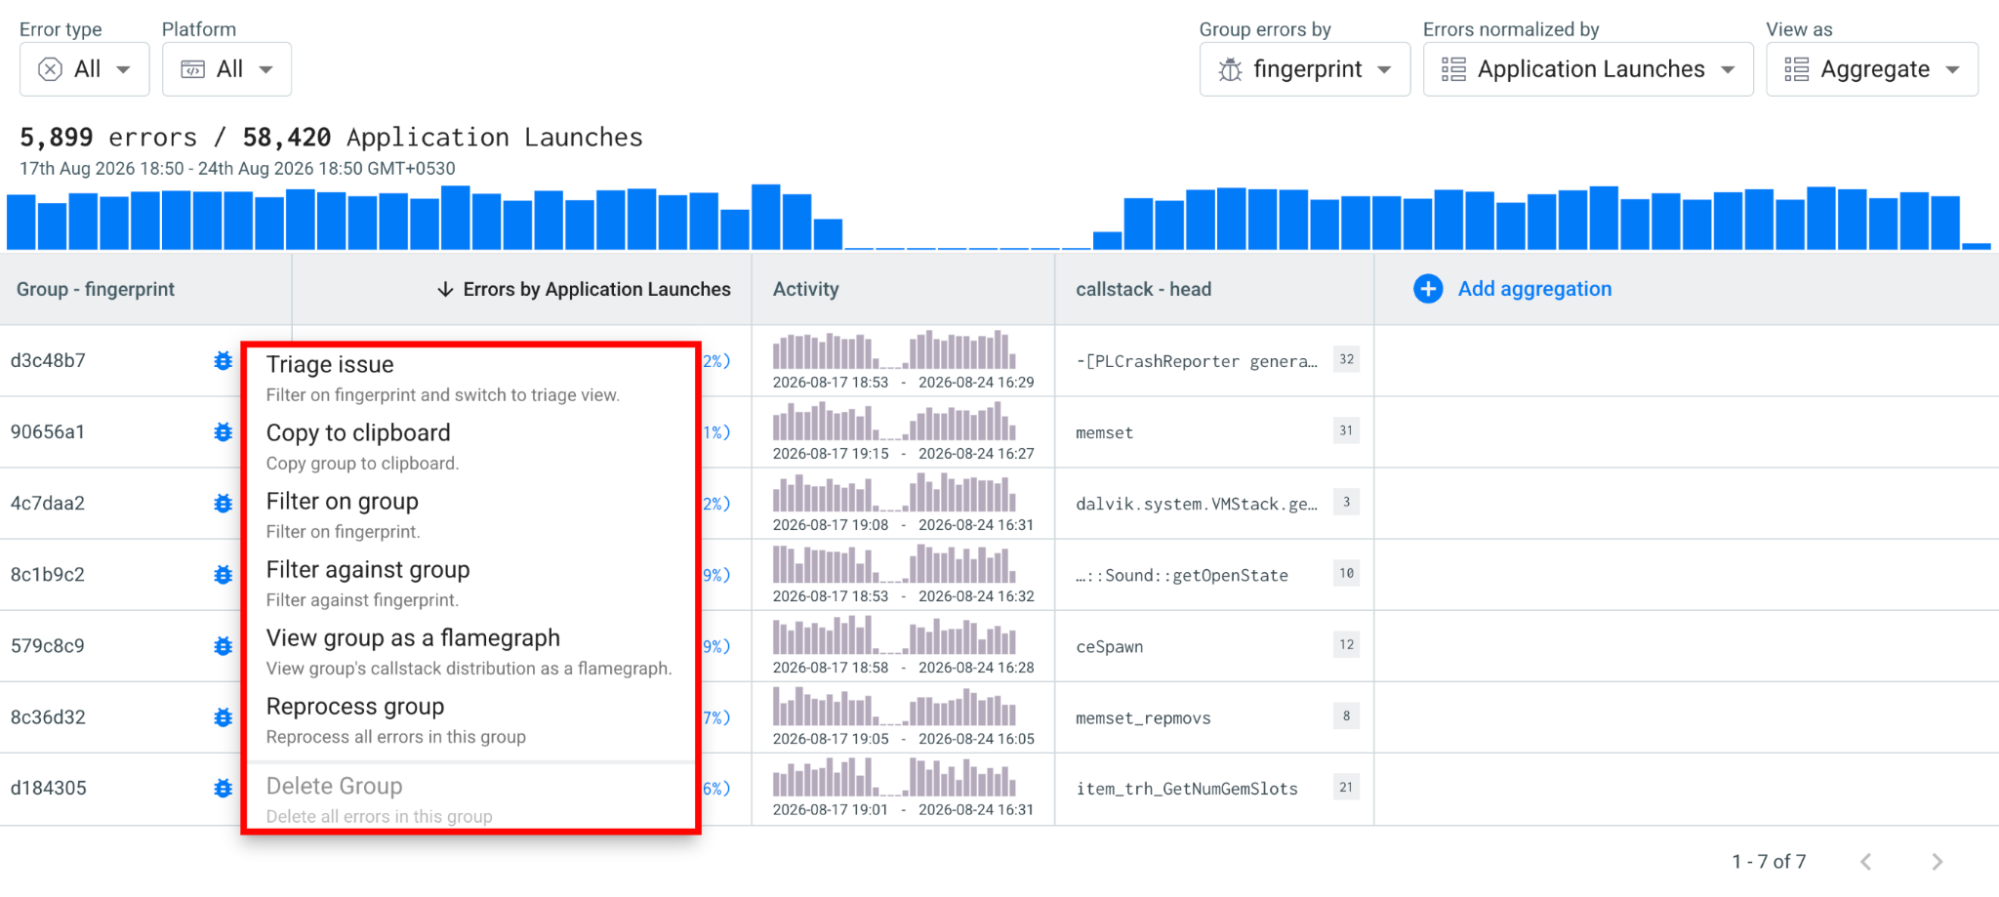
Each error group also includes a More options menu that provides additional actions for investigating and managing the selected group. Select the More options icon next to a group to open the available actions.
The menu includes the following options:
| Option | Description |
|---|---|
| Triage issue | Filters the selected group and switches to the Triage view so you can investigate the issue in more detail. |
| Copy to clipboard | Copies the selected group information to the clipboard. |
| Filter on group | Applies a filter for the selected group so that Explore displays only the matching error data. |
| Filter against group | Filters the results to show error data in relation to the selected group. |
| View group as a flamegraph | Opens the selected group's callstack distribution as a Flame Graph, allowing you to examine how errors are distributed across the callstack. |
| Reprocess group | Reprocesses all errors in the selected group. |
| Delete Group | Deletes all errors associated with the selected group. |