Customize Error Views
The Explore view provides multiple ways to analyze your error data. Use the View as option to switch between Aggregate, List, Flame Graph, and Similarity views, depending on the type of analysis you want to perform.
Select an Error View
Use the View as option in Explore to choose how you want to display and analyze your error data.
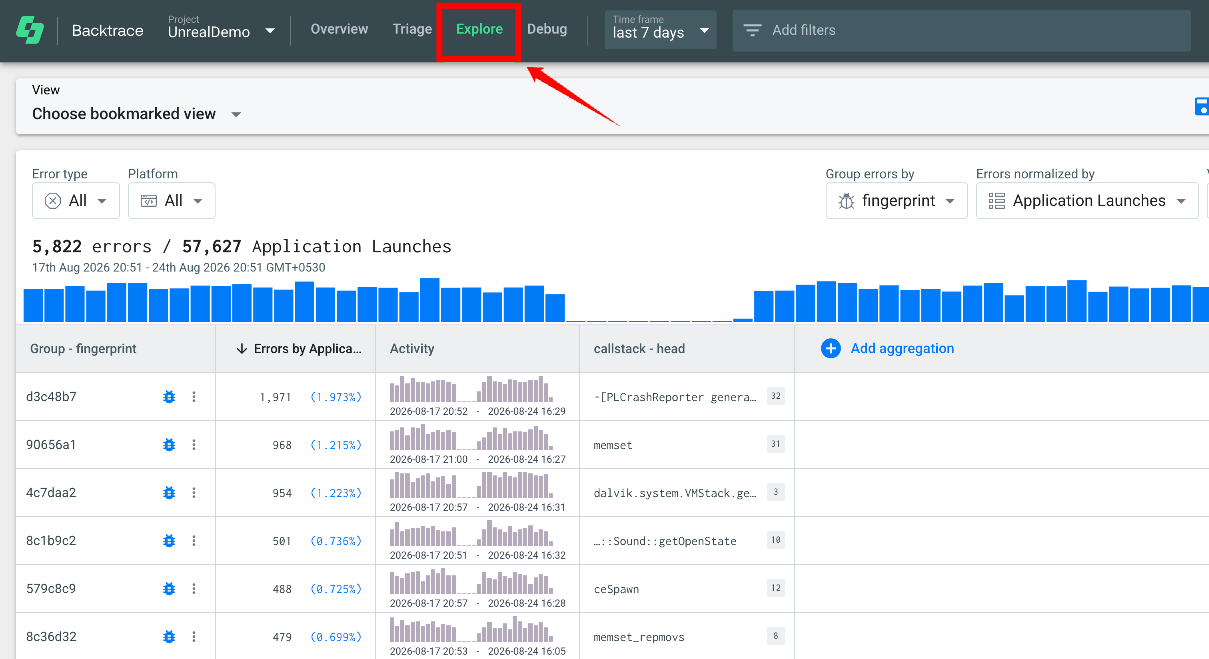
Step 1: Open Explore from the Error Reporting navigation. The Explore view opens with your available error data and analysis controls.
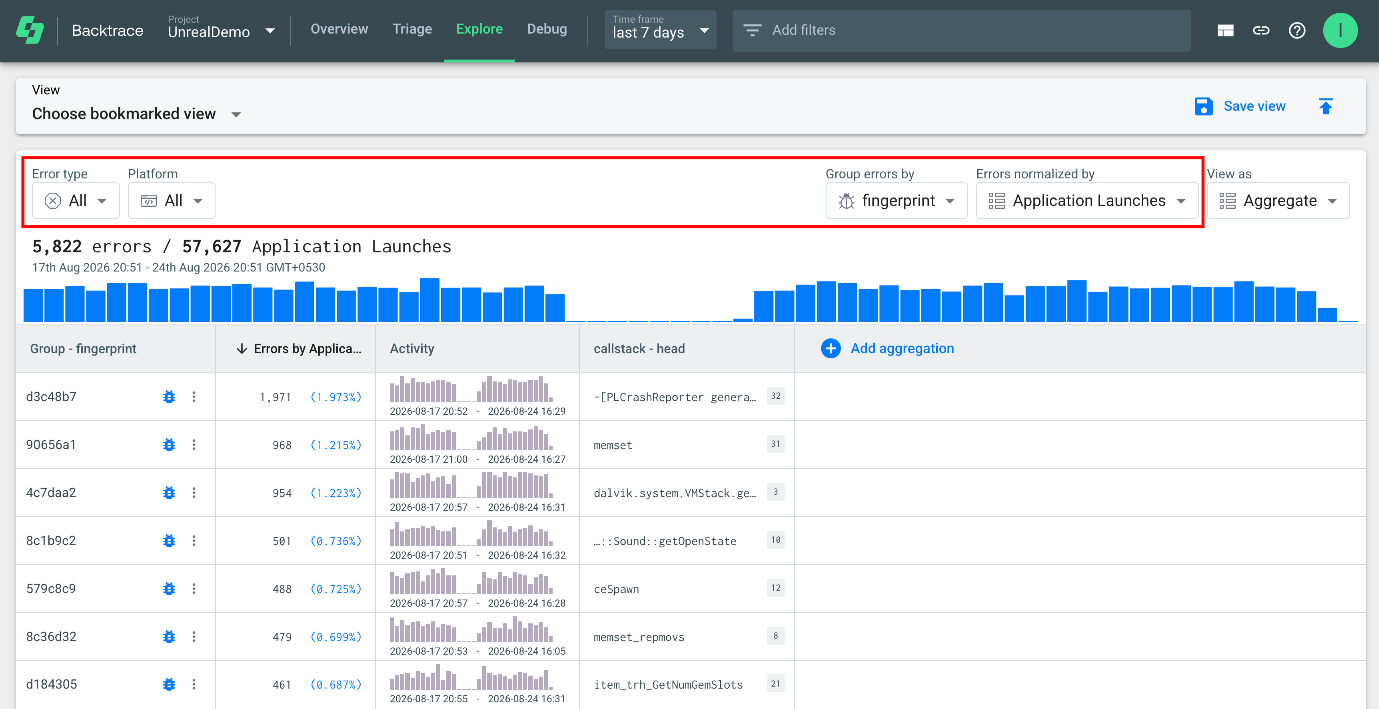
Step 2: Before selecting a view, use the available Explore controls to define the data you want to analyze. You can apply filters such as Error type, Platform, and Error Normalized by, and use Group errors by when applicable.
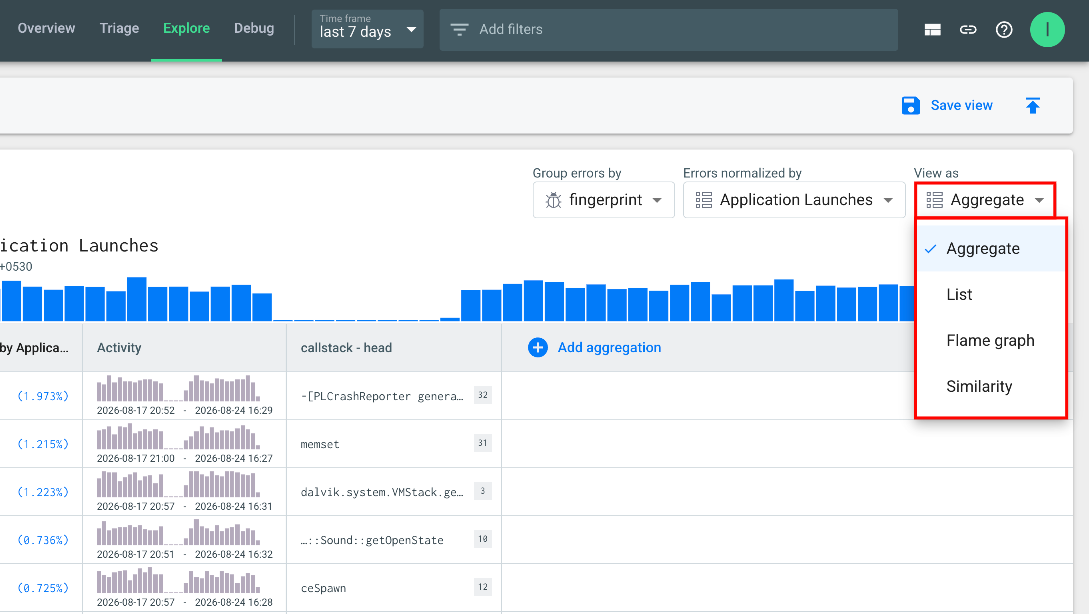
Step 3: In the Explore view, open the View as dropdown list on the right side of the results. Select the view you want to use:
- Aggregate: Groups and summarizes error data.
- List: Displays individual error records.
- Flame Graph: Visualizes callstack activity.
- Similarity: Displays errors based on their similarity.
After selecting a view, Explore refreshes the results using the selected display. You can switch between views at any time to examine the same error data from a different perspective.
Aggregate
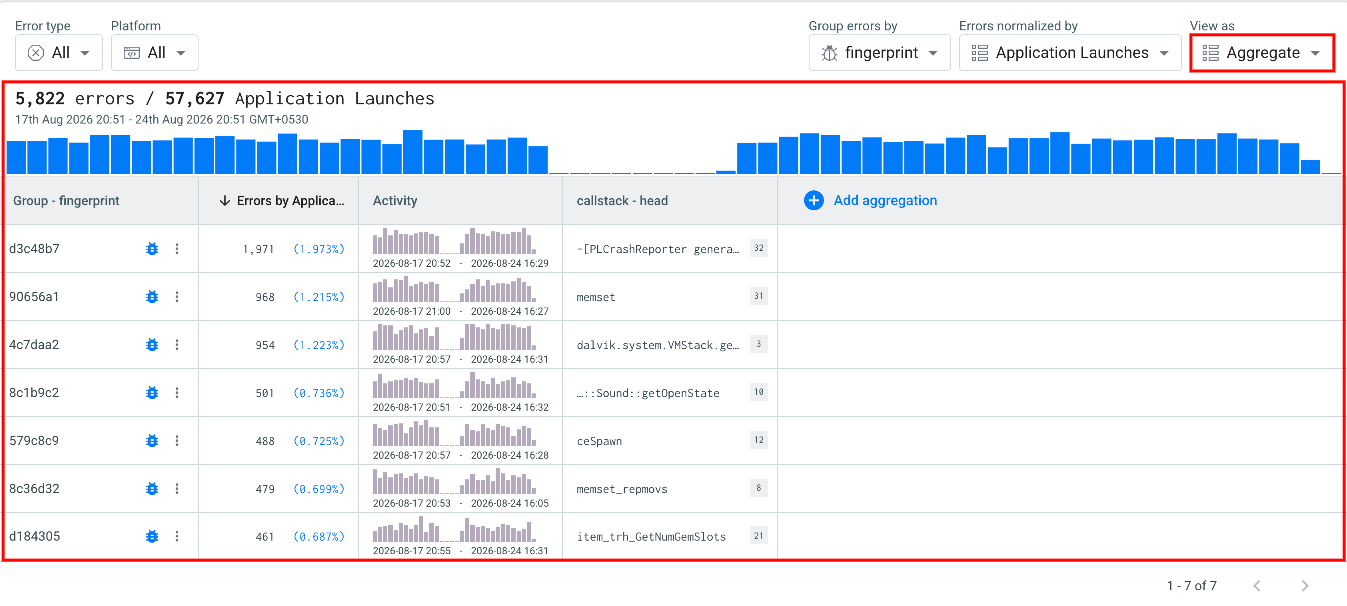
The Aggregate view groups errors based on the attribute selected under Group errors by. It provides a summarized view of your error data and allows you to add additional aggregations.
For example, you can group errors by application.version to compare errors across different application versions. The results display each version along with its error count, activity, and other available information.
You can also select Add aggregation to add additional attributes or metrics to the results.
Use the Aggregate view when you want to:
- Compare errors across groups.
- Analyze error counts and activity.
- Add additional aggregations to your results.
- Identify patterns across attributes such as application version or fingerprint.
List
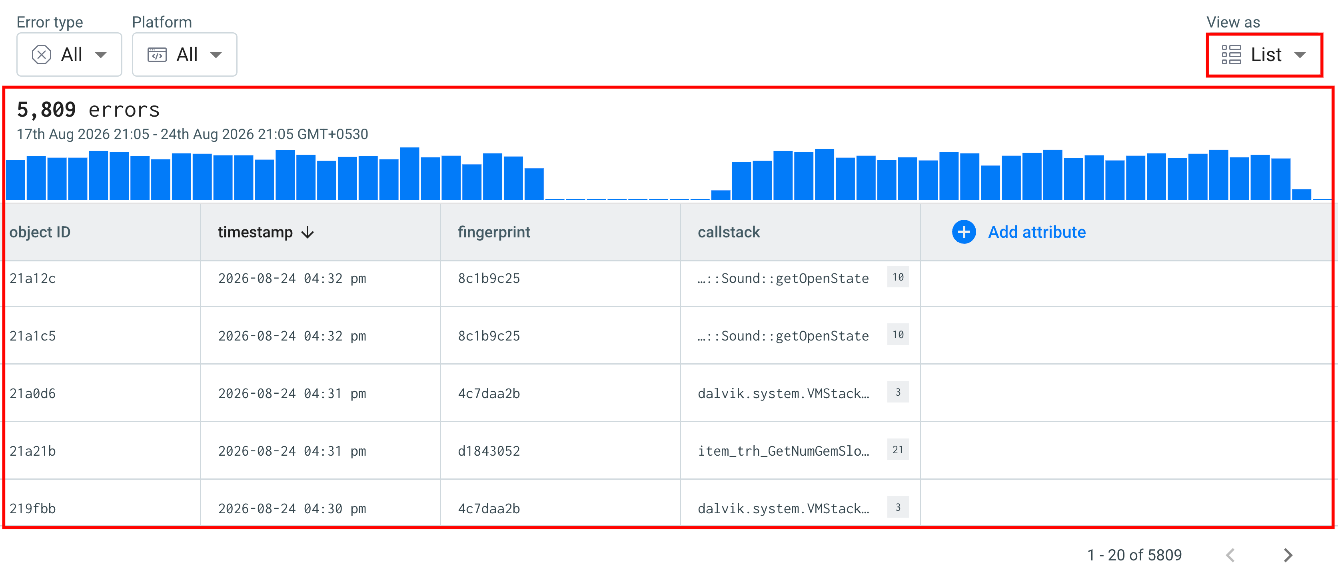
The List view displays individual error records instead of grouping them into summarized results.
The results include information such as Object ID, timestamp, fingerprint, and callstack. You can also select Add attribute to add additional information to the list.
For example, you can use the List view when you want to review individual error occurrences and examine when they hvoaxnnrb which fingerprint they belong to, and their associated caxii xbszt
Use the List view when you want to:
- Review individual error records.
- Examine timestamps and fingerprints.
- Inspect callstack information.
- Add additional attributes to the results.
Flame Graph
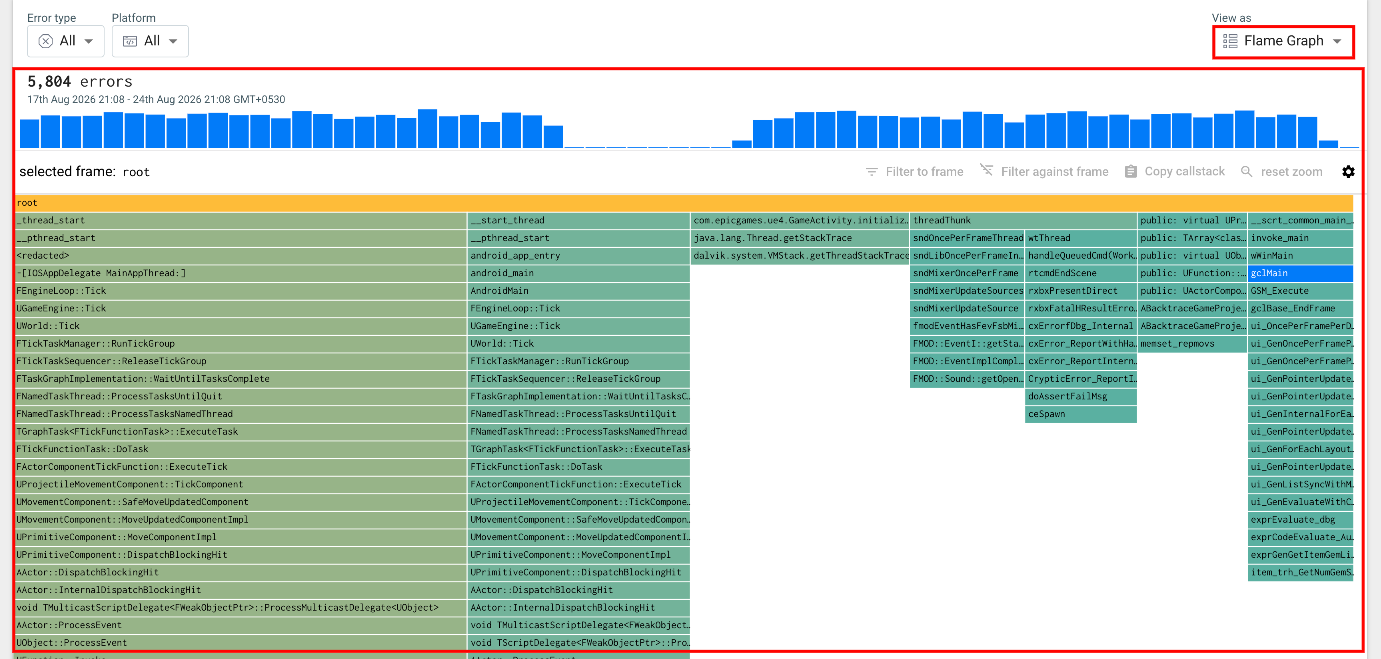
The Flame Graph view provides a visual representation of callstack data. Each section of the graph represents part of the callstack, allowing you to see how different frames contribute to the overall error data.
You can select different frames in the graph to focus your investigation. The view also provides options such as Filter to frame, Filter against frame, Copy callstack, and reset zoom.
For more information, see Flame Graph
Use the Flame Graph view when you want to:
- Visualize callstack activity.
- Identify frequently occurring callstack frames.
- Focus on a specific frame.
- Investigate relationships between different parts of a callstack.
Similarity
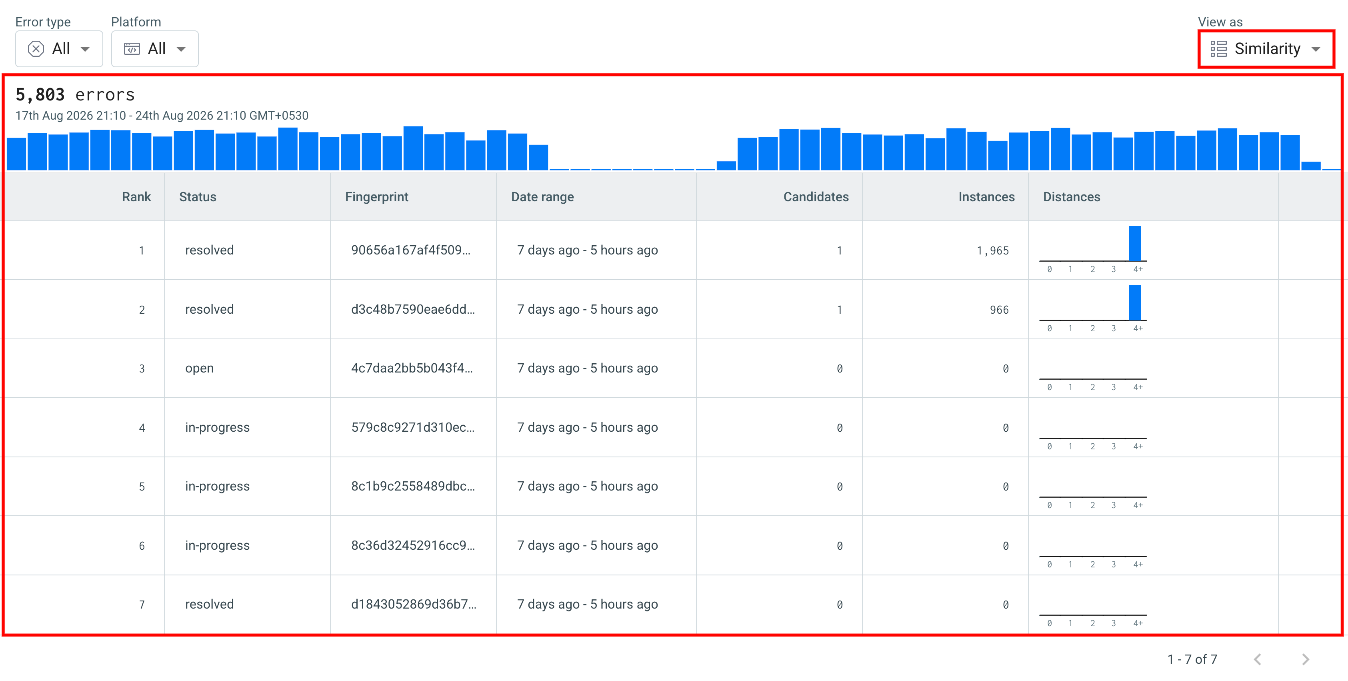
The Similarity view helps you identify errors that may be related based on their similarity.
The results are organized using information such as Rank, Status, Fingerprint, Date range, Candidates, Instances, and Distances. The Distances column provides a visual indication of how closely errors are related.
For example, the Similarity view can help you investigate whether different fingerprints may represent related or similar error conditions.
Use the Similarity view when you want to:
- Find potentially related errors.
- Compare similar fingerprints.
- Review the number of candidate matches and instances.
- Investigate relationships between different errors.