Identifying Common Failure Patterns
Failure Analysis helps you identify recurring failure patterns across your test suite. It analyzes test pass/fail data to find common patterns, determine how frequently they occur, and highlight the failures that have the greatest impact on your tests.
Failure Analysis uses machine learning to analyze your organization's test data. Each organization has its own machine learning model trained only on that organization's data. A failure pattern can be established after at least three failures occur on tests with the same name.
Failure Analysis can help you:
-
Identify recurring failures across your test suite.
-
Prioritize failures that affect a large number of tests.
-
Understand whether a failure is isolated or part of a larger pattern.
-
Investigate the specific test actions associated with a failure.
-
Move from a recurring failure pattern to the individual test execution for further debugging.
Failure Analysis supports Selenium and Appium tests on Virtual Devices and Real Devices. Visual testing is not supported. Appium is supported for mobile web applications, but not for native applications. Tests must also be configured to report a pass/fail result for Failure Analysis to analyze them.
Access Failure Analysis
You can access Failure Analysis from two locations in Sauce Labs:
-
Insights: Open Failure Analysis from the main navigation to analyze failures across your team or organization.
-
Builds: Open Failure Analysis from a specific build to investigate failure patterns associated with that build.
Access Failure Analysis from Insights
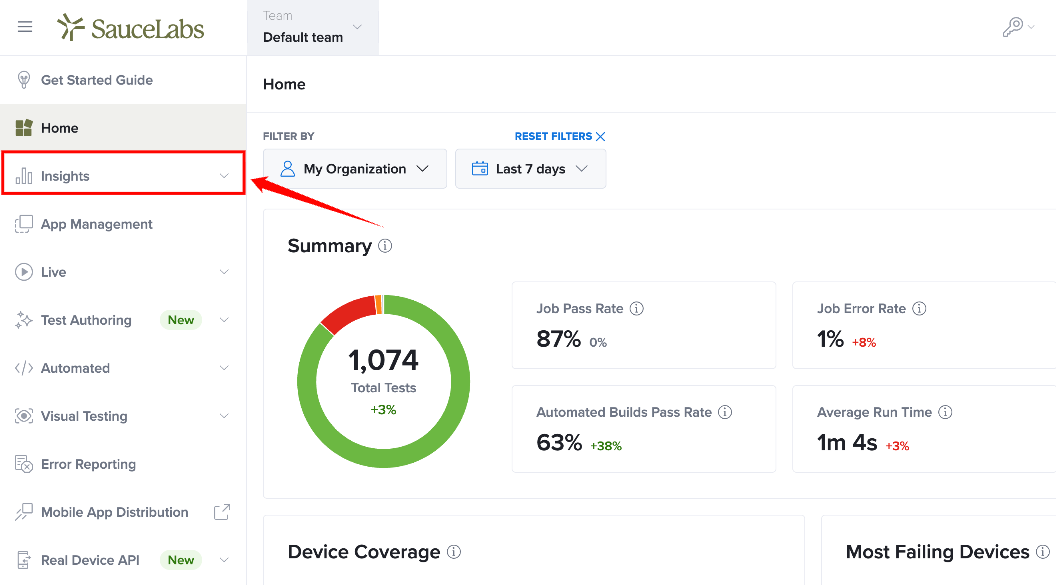
Step 1: Inside your Sauce Labs account, navigate to the left-side menu, locate Insights, and click it to expand the available options.
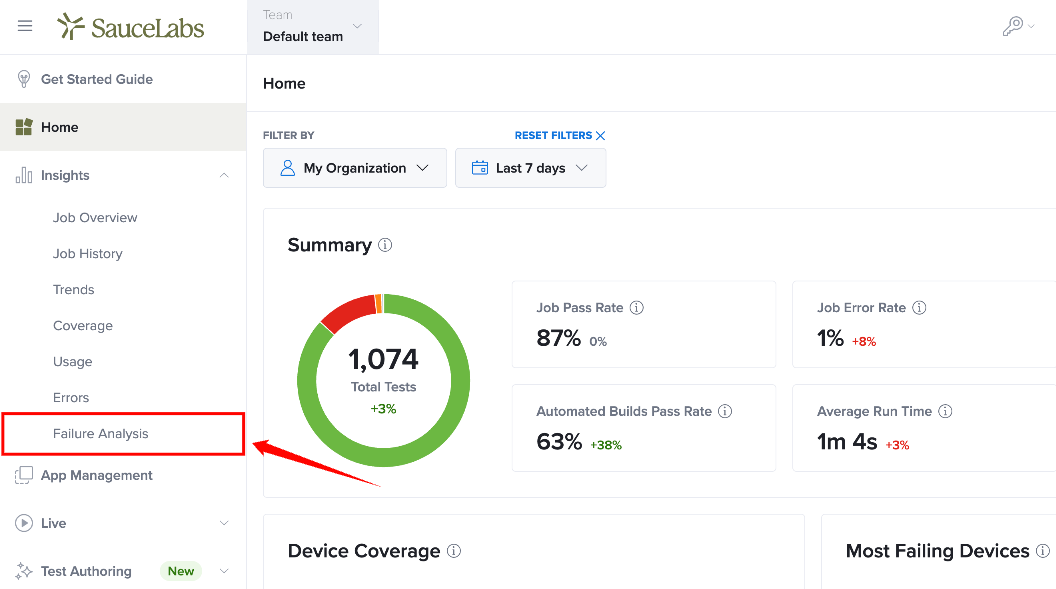
Step 2: From the expanded Insights menu, select Failure Analysis.
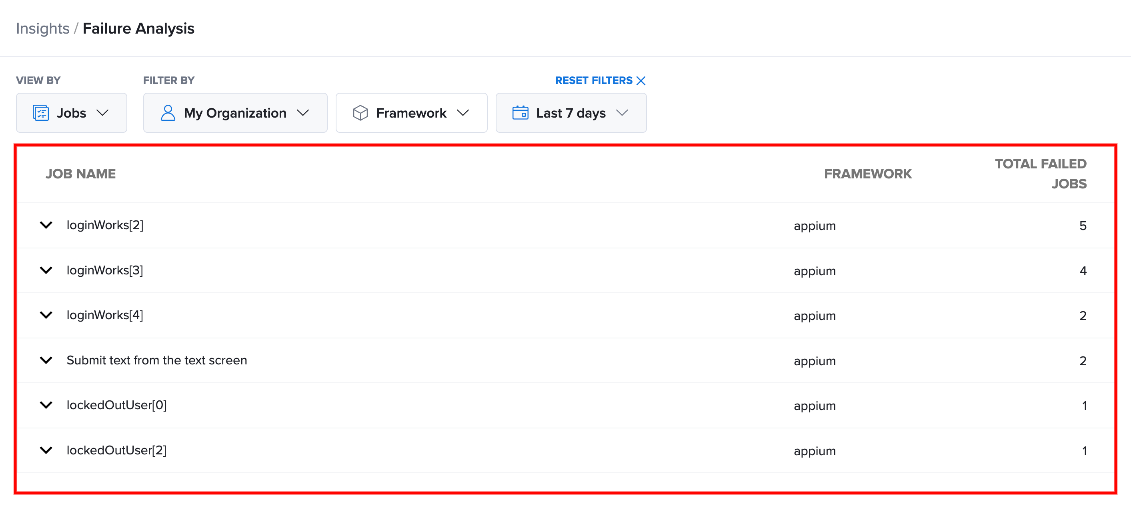
Step 3: The Failure Analysis page opens and displays failure data for your team or organization. By default, the page displays data from the last 7 days.
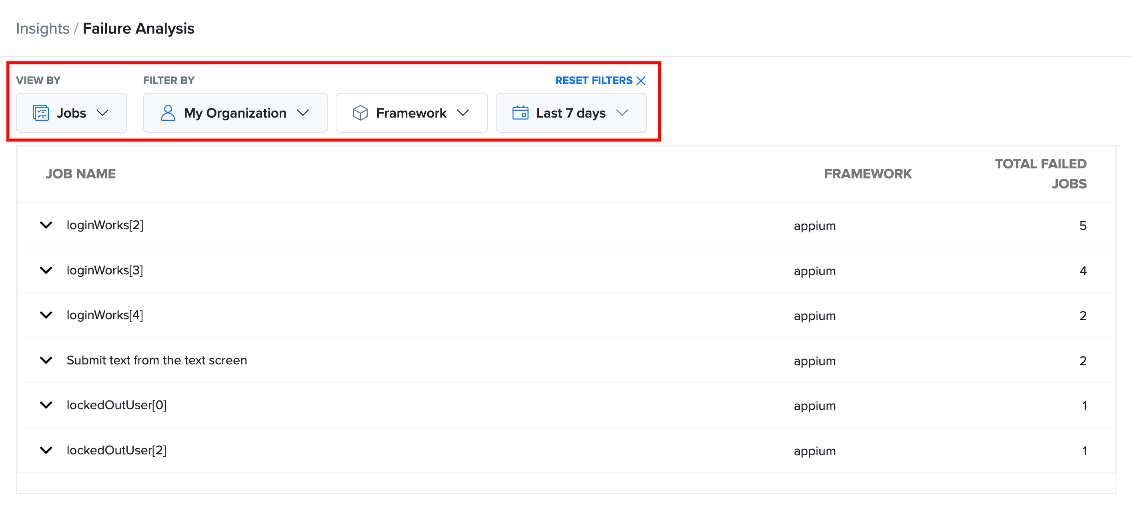
You can use the available views and filters to focus the analysis on specific tests, owners, frameworks, or time periods.
Access Failure Analysis from a Build
You can also analyze failure patterns directly from a specific build. This is useful when you want to investigate whether a particular build contains recurring failures.
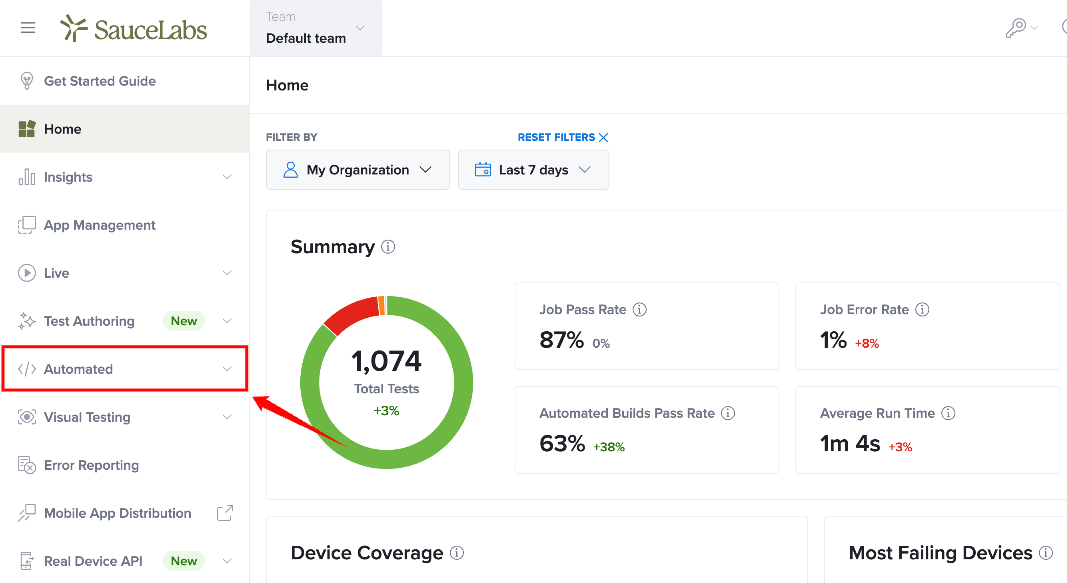
Step 1: Inside your Sauce Labs account, navigate to the left-side menu, locate Automated, and click it to expand the available options.
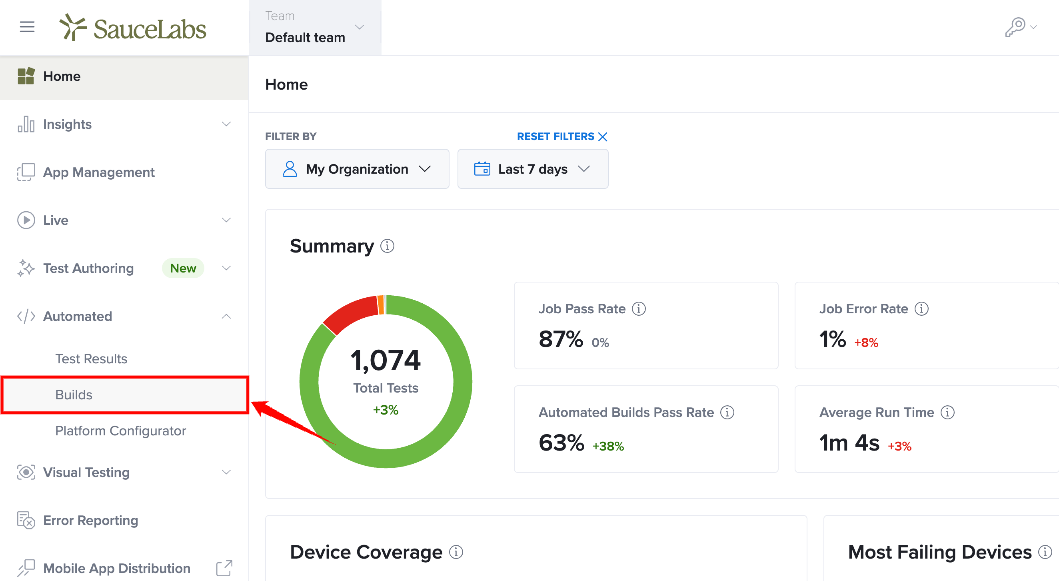
Step 2: From the expanded Automated menu, select Builds.
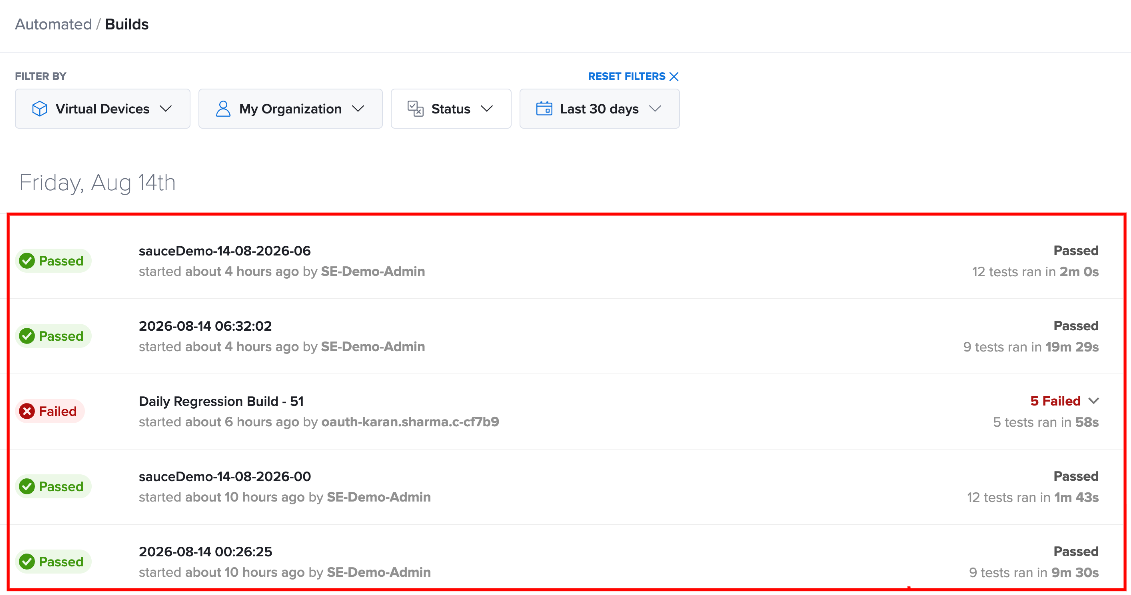
Step 3: On the Builds page, select the build you want to analyze.
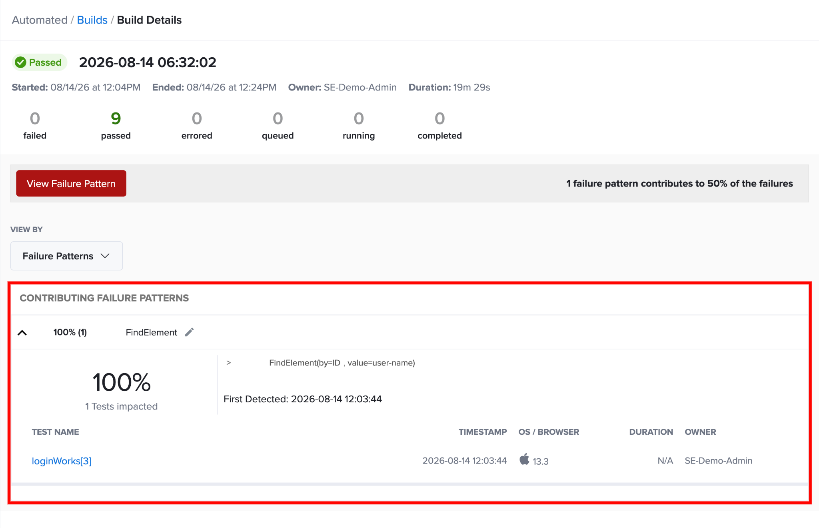
Step 4: Click View Failure Pattern to open the failure pattern analysis, or use View By and select Failure Patterns to switch to the failure pattern view.
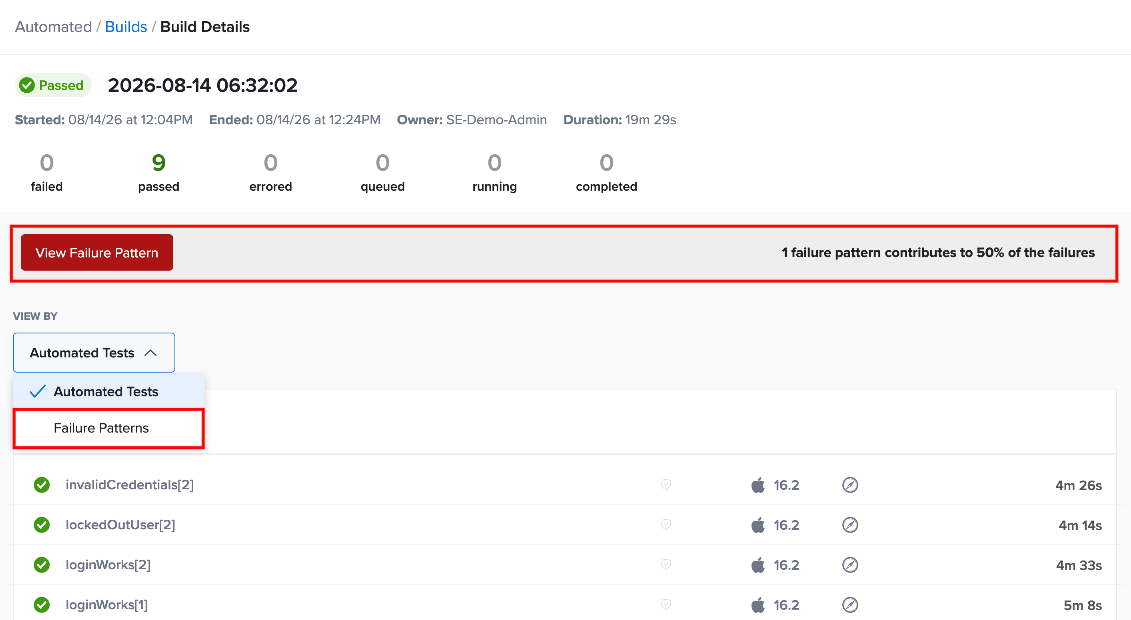
The Failure Analysis view opens and displays the failure patterns associated with the selected build.
How Failure Analysis Works
Failure Analysis analyzes your test execution data to identify potential failure patterns based on recurring test failures. It groups failures from tests with the same name, identifies common patterns, and prioritizes those patterns based on their impact.
The analysis follows these steps:
-
Identifies failed tests: Failure Analysis identifies test executions that did not pass.
-
Aggregates failures by test name: Failures from tests with the same name are analyzed together.
-
Detects common failure patterns: Failure Analysis looks for recurring actions or commands associated with the failures.
-
Ranks failure patterns by impact: Identified patterns are prioritized based on how frequently and broadly they affect the tests.
A failure pattern can be established after at least three failures occur on tests with the same name. This allows Failure Analysis to identify recurring behavior rather than treating an individual failure as a common pattern.
Improved Failure Pattern Naming
Failure Analysis uses an improved command decoder to make the actions associated with failure patterns easier to understand.
Test commands can contain values such as hashes, element IDs, or other identifiers that are required for test execution but may not clearly describe what the test was doing. The command decoder converts these commands into a more readable representation that more closely describes the action performed during the test.
For example, instead of requiring you to interpret a technical command or element identifier, the failure pattern can present the action in a format that more clearly represents the test step, such as:
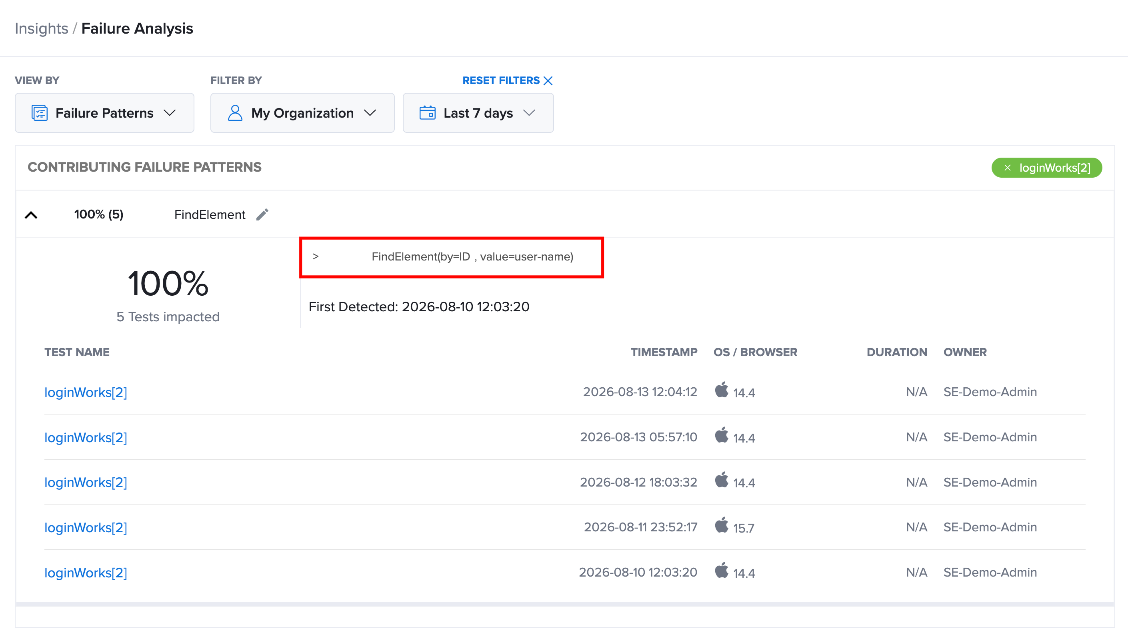
FindElement(by\=ID, value\=user-name)
This makes it easier to recognize which action is failing and determine whether the same action is responsible for failures across multiple test executions.
The decoded command information is available when reviewing failure patterns and can also be used when investigating the corresponding test execution.
View Failure Patterns
After accessing Failure Analysis, use the Failure Patterns view to identify recurring failures and understand their impact on your test suite.
The view organizes identified patterns so that you can focus on the failures that have the greatest impact.
Each failure pattern can be expanded to review additional information about the pattern and the tests affected by it.
Understand Failure Pattern Details
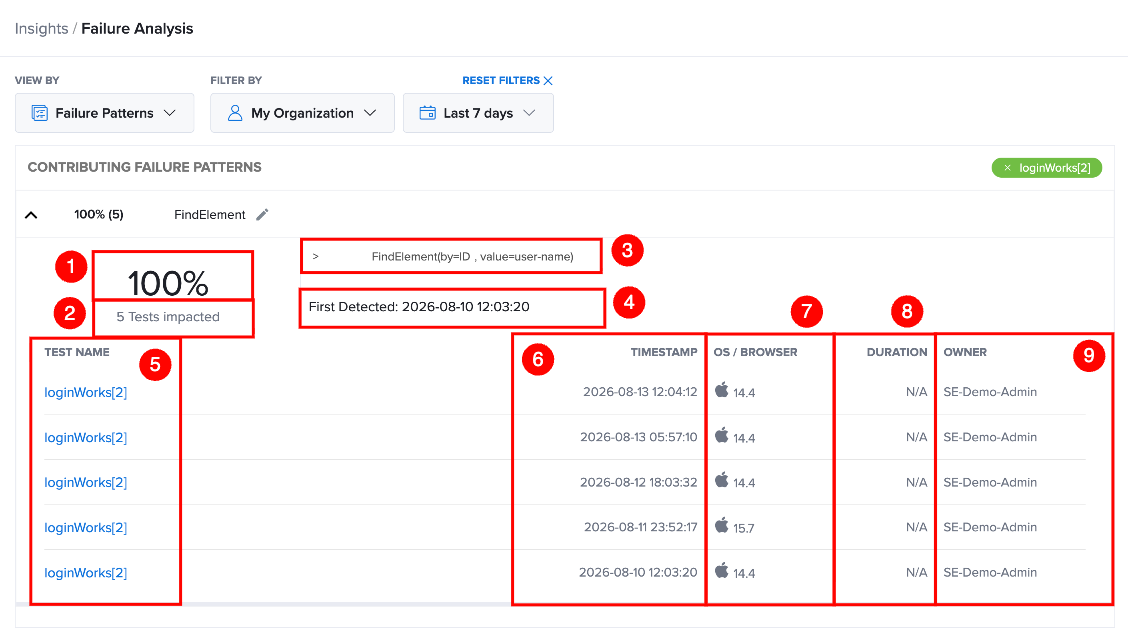
The Failure Patterns view displays the identified failure pattern, its impact on the test suite, and the test executions affected by the pattern. The following information is available for each pattern:
| Ref. | Field | Description |
|---|---|---|
| 1 | Failure Pattern | Displays the identified failure pattern, such as FindElement, which represents the common test action associated with the failures. |
| 2 | Impact | Shows the percentage of failures associated with the pattern and the number of affected tests. For example, 100% (5) indicates that the pattern accounts for 100% of the identified failures across 5 tests. |
| 3 | Failure Action | Displays the decoded test action associated with the failure pattern, such as FindElement(by=ID, value=user-name). |
| 4 | First Detected | Shows the date and time when the failure pattern was first identified. |
| 5 | Test Name | Displays the name of each test affected by the failure pattern. Select a test name to open its corresponding test details. |
| 6 | Timestamp | Shows when the affected test execution occurred. |
| 7 | OS / Browser | Displays the operating system and browser or device environment used for the test execution. |
| 8 | Duration | Displays the duration of the affected test execution. |
| 9 | Owner | Shows the user or account associated with the test execution. |
Investigate a Failure Pattern
After identifying a failure pattern, you can investigate the affected test executions to understand where the failure occurs and determine what happened during the test.
The Failure Patterns view provides a starting point by showing which tests are affected by a pattern. From there, you can open an individual test execution and inspect the commands, failure response, video, logs, and other test details.
Open an Affected Test
Step 1: In the Failure Patterns view, expand the failure pattern you want to investigate.
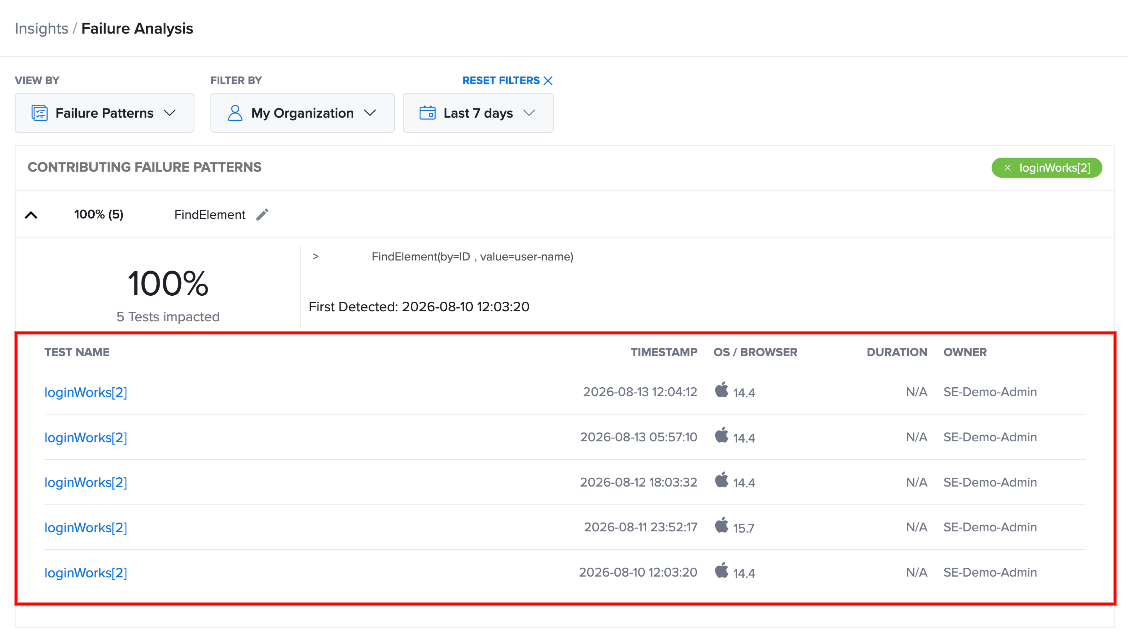
The expanded pattern displays the tests affected by the failure. Each test includes details such as the test name, execution timestamp, OS or browser, duration, and owner.
Step 2: Select the test name of the execution you want to investigate. The corresponding Test Details page opens for that test execution.
The test details page provides the complete execution context, including the test status, execution time, testing framework, device or browser, and available test artifacts.
Start with a test execution associated with the failure pattern you are investigating. This allows you to compare the identified failure action with the actual commands and test behavior.
Identify the Failure Pattern in Test Details
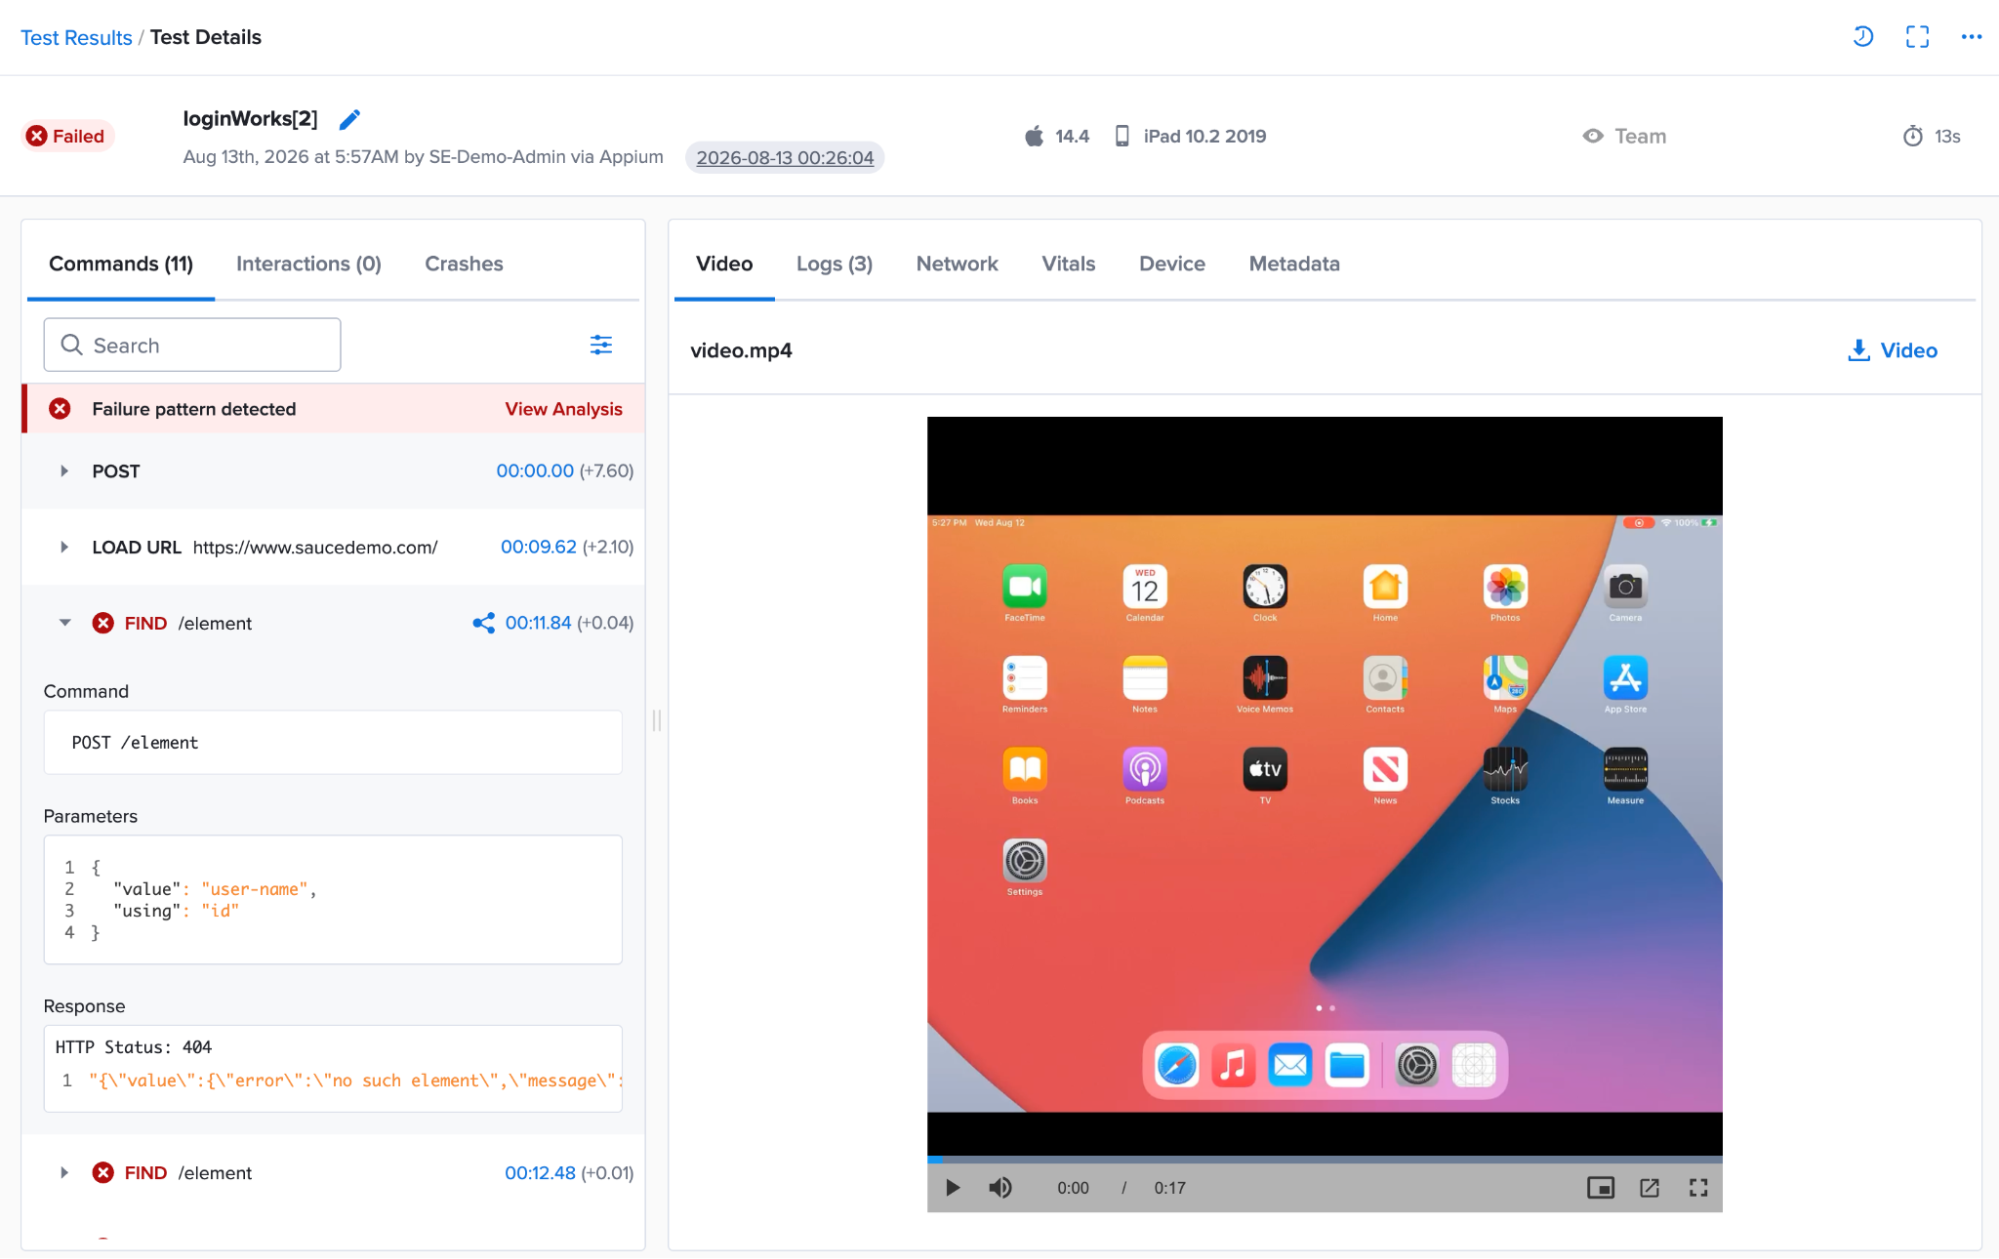
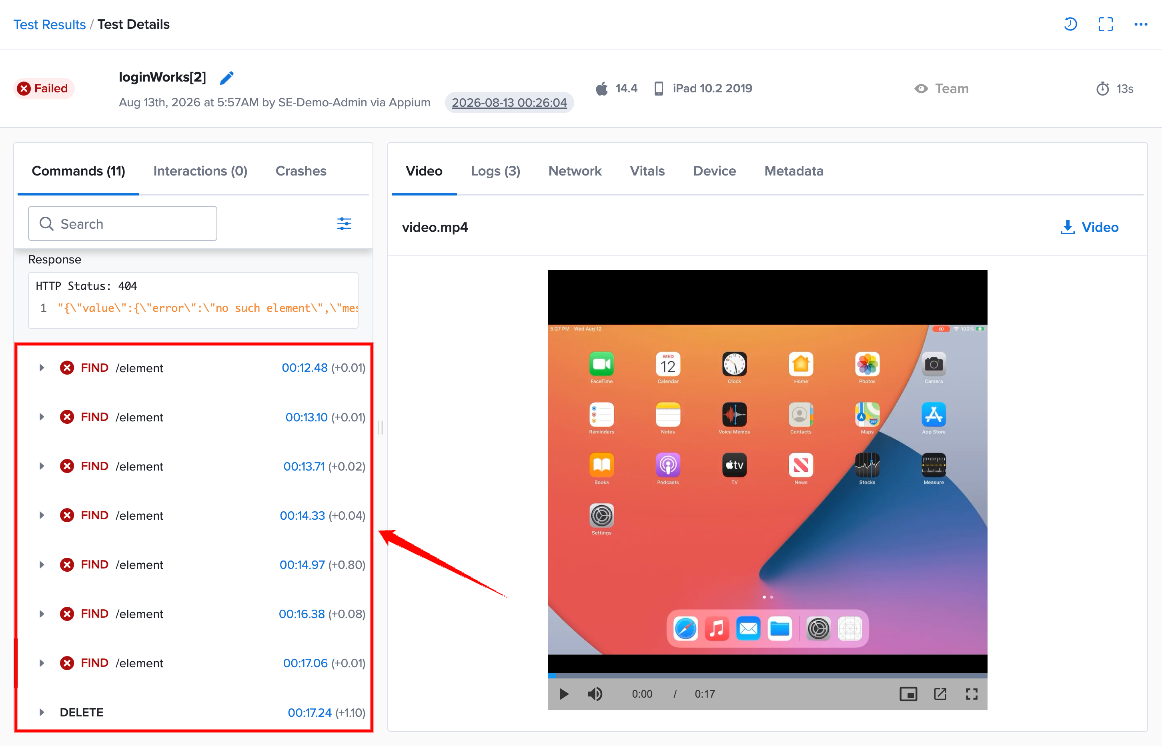
When a test contains a failure pattern, the Commands panel displays a Failure pattern detected notification.
The notification indicates that one or more commands in the test execution have been identified as part of a recurring failure pattern. Select View Analysis to return to the related failure analysis information.
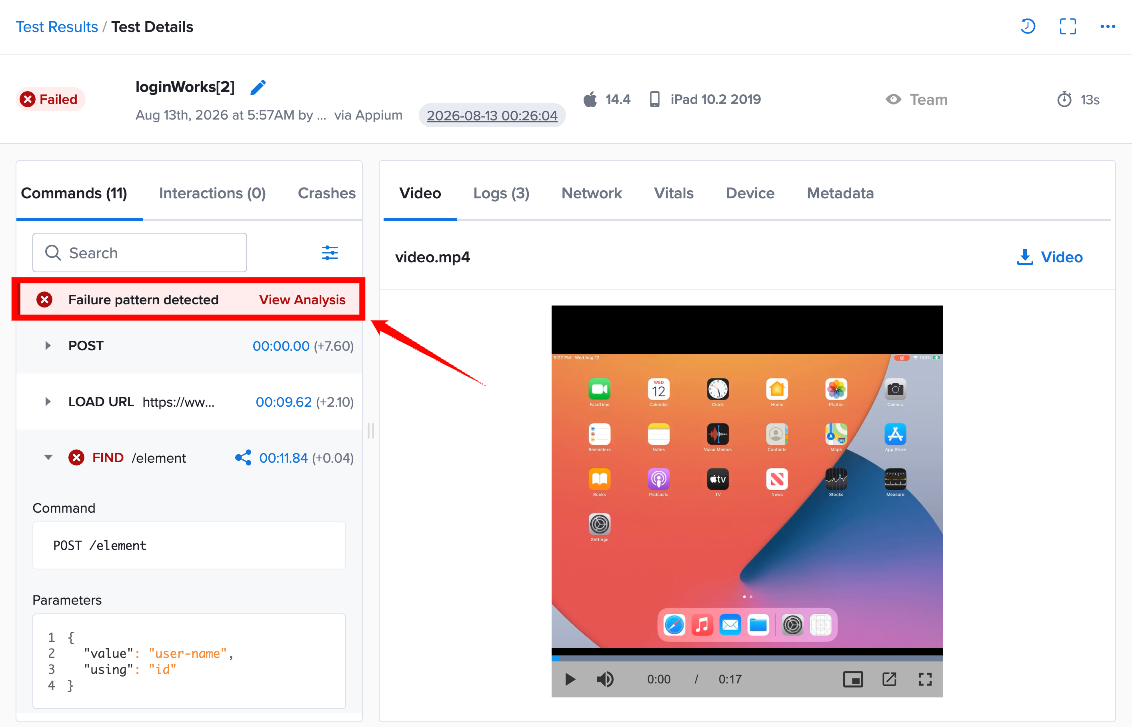
You can also use the filter control in the Commands panel to display only commands that have an identified failure pattern by selecting the filter icon next to the search field and then selecting Has Failure Pattern.
Review the Failure Command
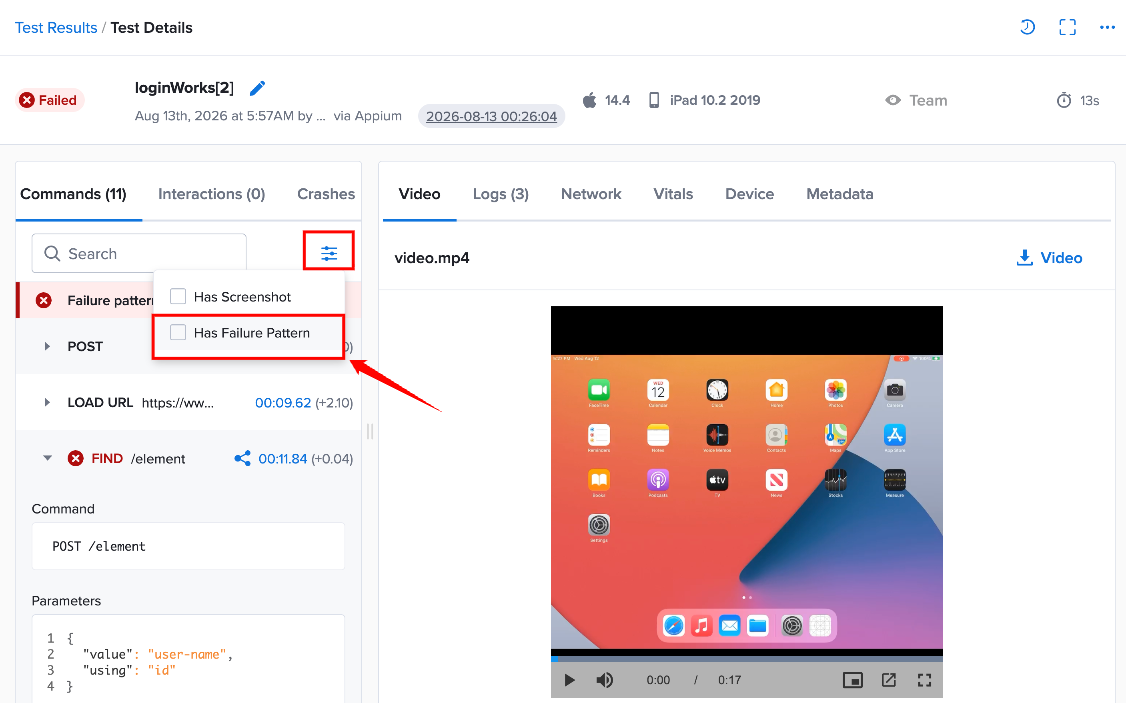
After isolating the failure-pattern commands, expand the relevant command to review its details.
The command details can include:
-
Command: The command executed by the test, such as
POST /element. -
Parameters: The values passed to the command, such as the element locator.
-
Response: The response returned by the command. For example, a
404response can indicate that the requested element was not found.
The failure-pattern command helps you identify the specific test action associated with the recurring failure.
For example, a command may appear as:
POST /element
with parameters similar to:
{
    "using": "id",
    "value": "user-name"
}
The response can then show the error returned for that action.
This information helps you determine whether the failure is related to a specific element, locator, command, or response.
Review the Test at the Failure Timestamp
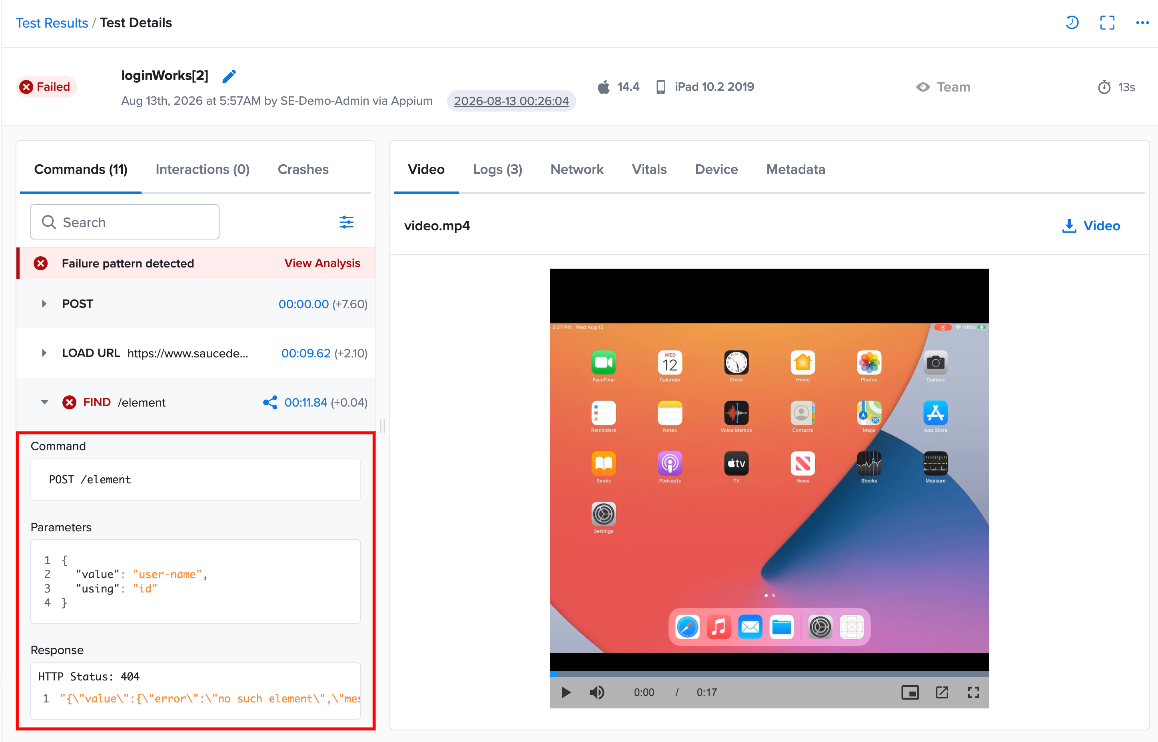
The timestamp displayed next to a command indicates when that command was executed during the test.
Select the timestamp associated with the failure command to move to that point in the test execution. You can then use the test video to verify what happened on the device at the time of the failure.
For example, if a FindElement command fails because the user-name element cannot be found, review the video at that timestamp to determine whether:
-
The expected page had loaded.
-
The element was visible.
-
The application was still loading.
-
The application displayed an unexpected page or state.
This allows you to compare the command failure with the actual behavior captured during the test.
Use Failure Patterns to Prioritize Investigation
Failure Patterns can help you decide which failures to investigate first.
A pattern affecting many test executions may indicate a broader issue than a pattern that occurs in only one test. Use the percentage of impact, number of tests affected, and failure action shown in the Failure Patterns view to determine where to start.
For example, if a pattern affects 100% of the failures across 4 tests, as shown in the example below, the same action is associated with all four affected executions. Investigating that action and comparing the affected test executions can help determine whether they share a common cause.
When investigating a recurring pattern, compare the affected test executions and look for common conditions such as:
-
The same test action or command.
-
The same element or locator.
-
Similar application behavior before the failure.
-
The same or different device environments.
-
Similar responses or error messages.
This helps distinguish a recurring application problem from an issue specific to an individual test execution.
To enhance the power of the Failure Analysis tool, it is recommended to Provide Context for Selenium Commands with the JavaScript Executor.