Jobs Data Visualizations
The Job Overview page provides a consolidated view of your automated test execution health over a selected time period. It aggregates job execution data into visual reports that help you monitor test stability, identify execution trends, analyze test outcomes, and evaluate testing coverage across your environments.
These insights enable engineering teams to quickly detect regressions, identify flaky or consistently failing tests, and make informed decisions to improve the reliability of their test suite.
The Extended Debugging feature offers access to HAR files and JavaScript console logs, assisting in the identification of flaky tests. For more details, refer to Debugging Tests with JavaScript Console Logs and HAR Files (Extended Debugging).
Access Job Overview Page
Step 1: After signing in to your Sauce Labs account, click Insights in the left navigation menu to expand the Insights menu.
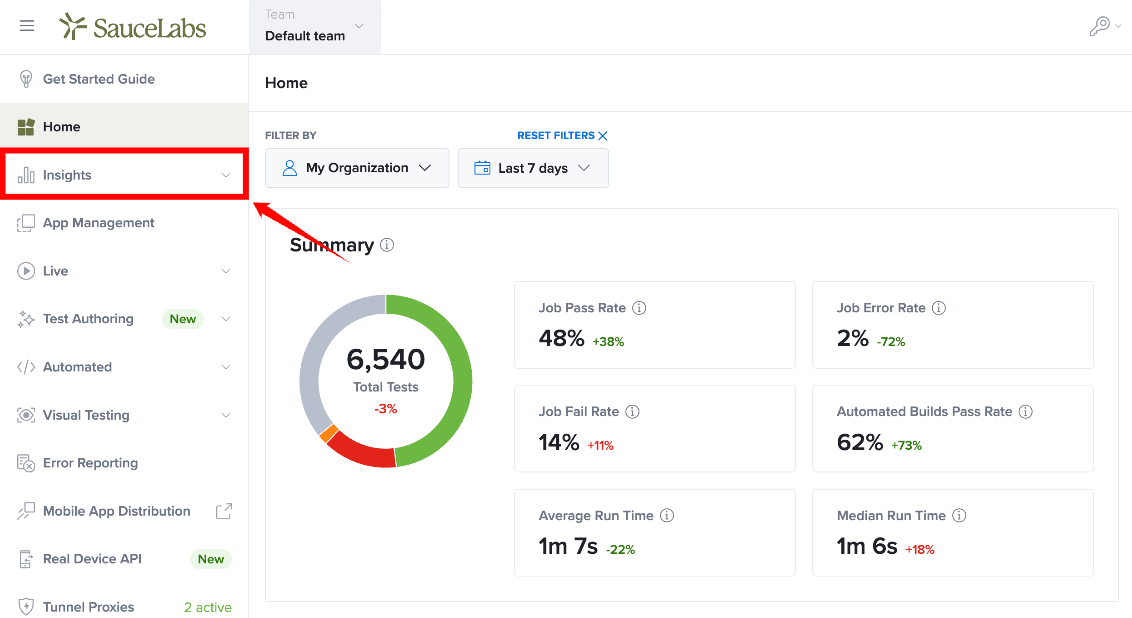
Step 2: From the expanded Insights, select Job Overview from the dropdown list.
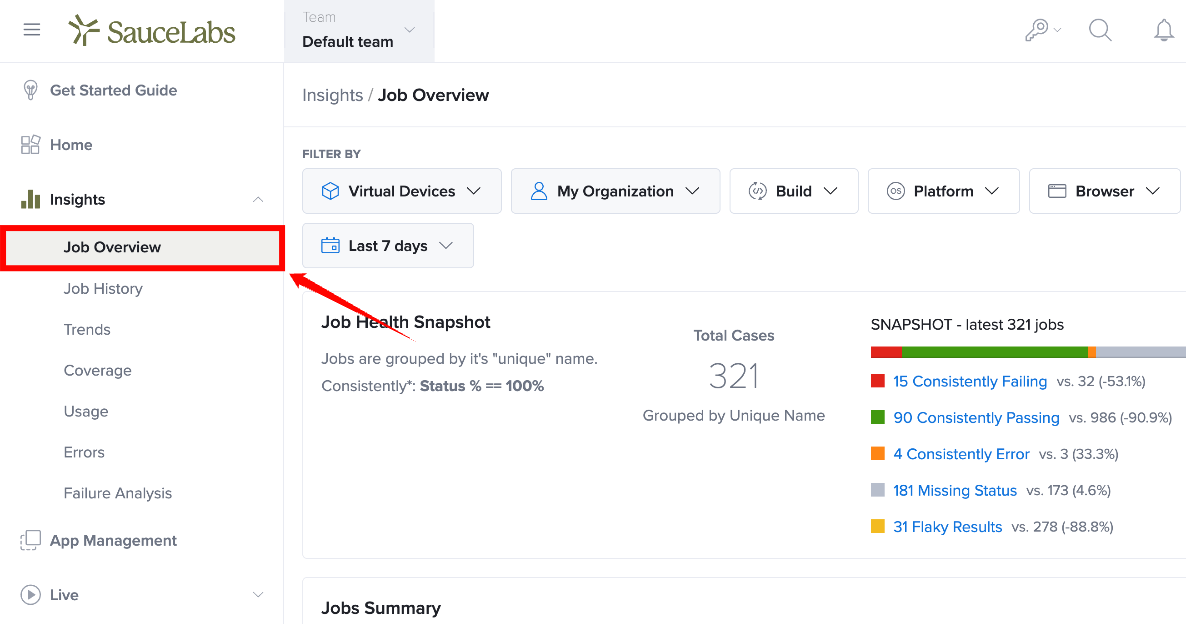
The Job Overview page displays visualizations that summarize the health, execution outcomes, and coverage of your automated test jobs. You can apply filters to narrow the displayed job execution data, and the visualizations automatically update to reflect your selection.
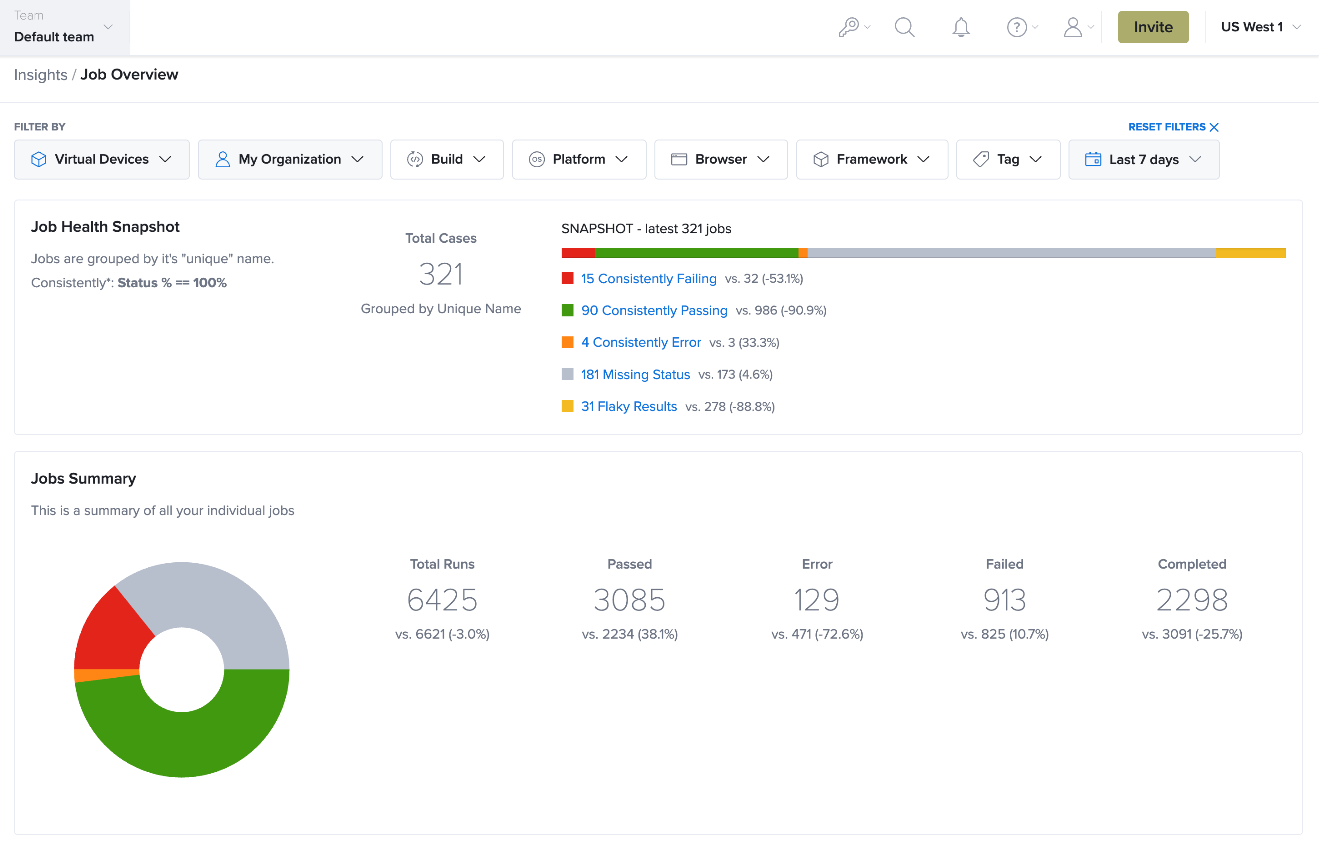
Job Health Snapshot
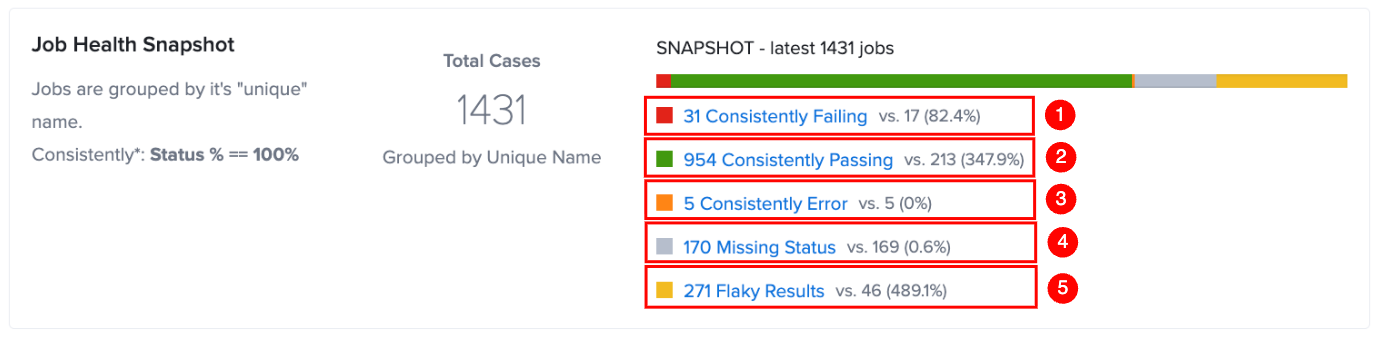
The Job Health Snapshot section provides a high-level overview of the health and consistency of your test jobs. Instead of displaying every individual execution, it groups jobs by their unique name. It classifies them based on how consistently they produce the same execution result over the selected reporting period.
This visualization helps you quickly understand whether your automated test suite is stable or whether certain tests require further investigation.
The section displays the following information:
-
Total Cases: Displays the total number of unique jobs included in the analysis.
-
Snapshot Bar: Displays the distribution of jobs across different health categories using a stacked bar chart.
-
Category Summary: Displays the number of jobs in each health category along with the percentage of total jobs.
The snapshot classifies jobs into the following categories:
| Ref. | Category | Description |
|---|---|---|
| 1 | Consistently Passing | Jobs that have undergone repeated executions and demonstrate stable behavior. |
| 2 | Consistently Failing | Jobs that repeatedly fail during execution indicate persistent test or application issues. |
| 3 | Consistently Erroring | Jobs that consistently end with execution or infrastructure-related errors instead of test failures. |
| 4 | Missing Status | Jobs that completed execution but did not report a final execution status. |
| 5 | Flaky Results | Jobs that alternate between passing and failing across executions indicate inconsistent or unstable behavior. |
Selecting a category displays the corresponding jobs, allowing you to further investigate their execution history.
Jobs Summary
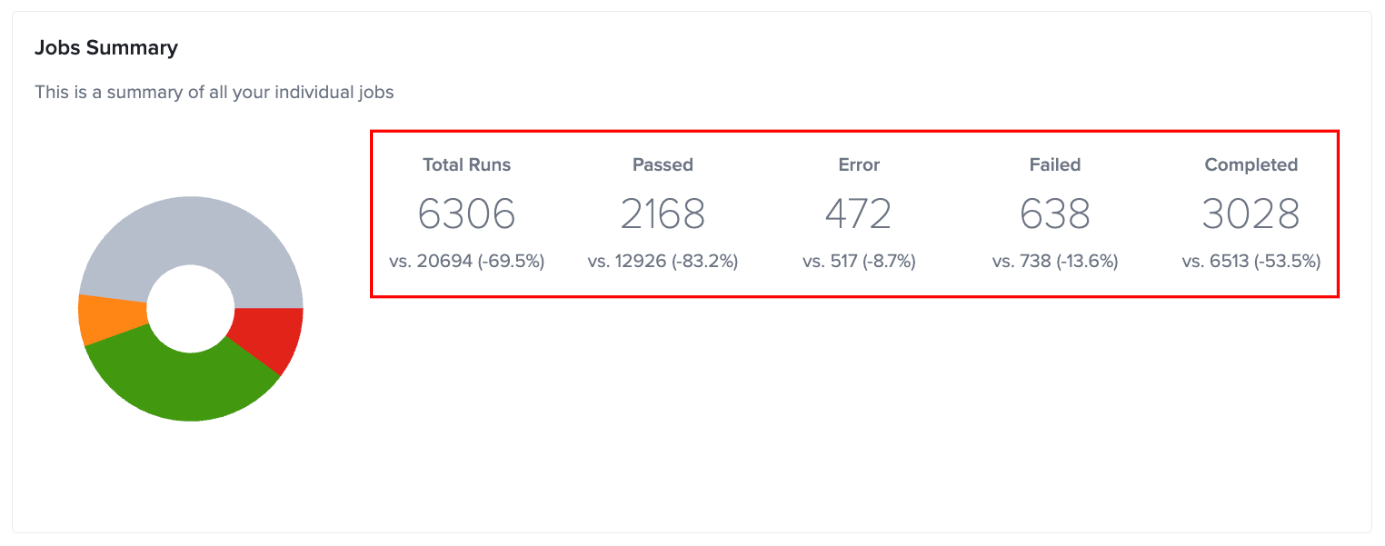
The Jobs Summary section displays a summary of job execution results for the selected reporting period. It includes a pie chart and numerical metrics that show the number and percentage of jobs for each execution status.
The displayed metrics are compared with those from the previous equivalent reporting period. For example, if the selected date range is Last 30 Days, the metrics are compared with the results from the previous 30-day period.
The section includes the following metrics:
| Metric | Description |
|---|---|
| Total Runs | Total number of job executions during the selected reporting period. |
| Passed | Number of jobs that were completed successfully. |
| Error | Number of jobs that ended because of execution or infrastructure-related errors. |
| Failed | Number of jobs that were completed with a failed status. |
| Completed | Number of jobs that were completed without reporting a final pass or fail status. |
The pie chart displays the distribution of job execution results for the selected reporting period.
Completed tests are sometimes aggregated due to not receiving a pass or failure declaration or intent. Be sure to send all your pass/fail results to Sauce Labs to take advantage of Insights.
Jobs Breakdown
The Jobs Breakdown section provides a detailed view of how your automated test jobs are distributed across different testing environments. It helps you evaluate your testing coverage and understand where your jobs are running, making it easier to identify gaps in your testing strategy and compare execution performance across environments.
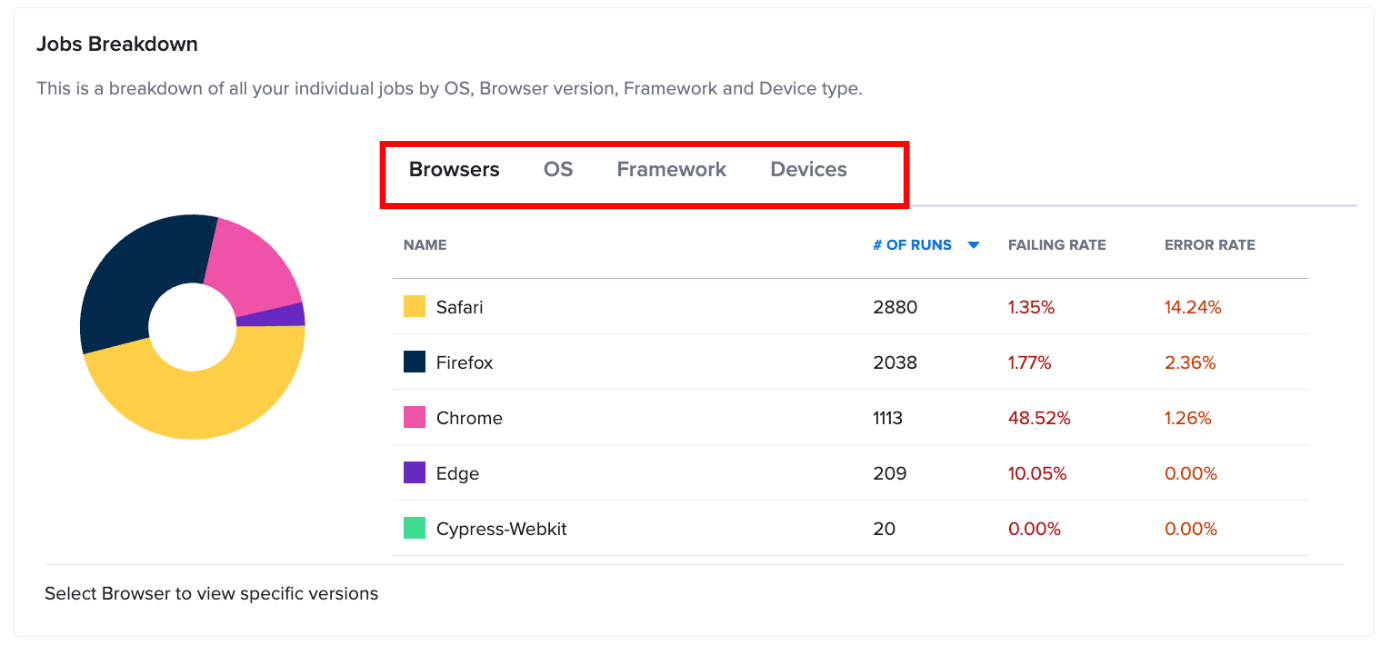
The section includes a chart and a corresponding data table that display execution metrics for the selected category.
You can analyze job execution data using the following categories:
-
Browsers
-
Operating Systems (OS)
-
Frameworks
-
Devices
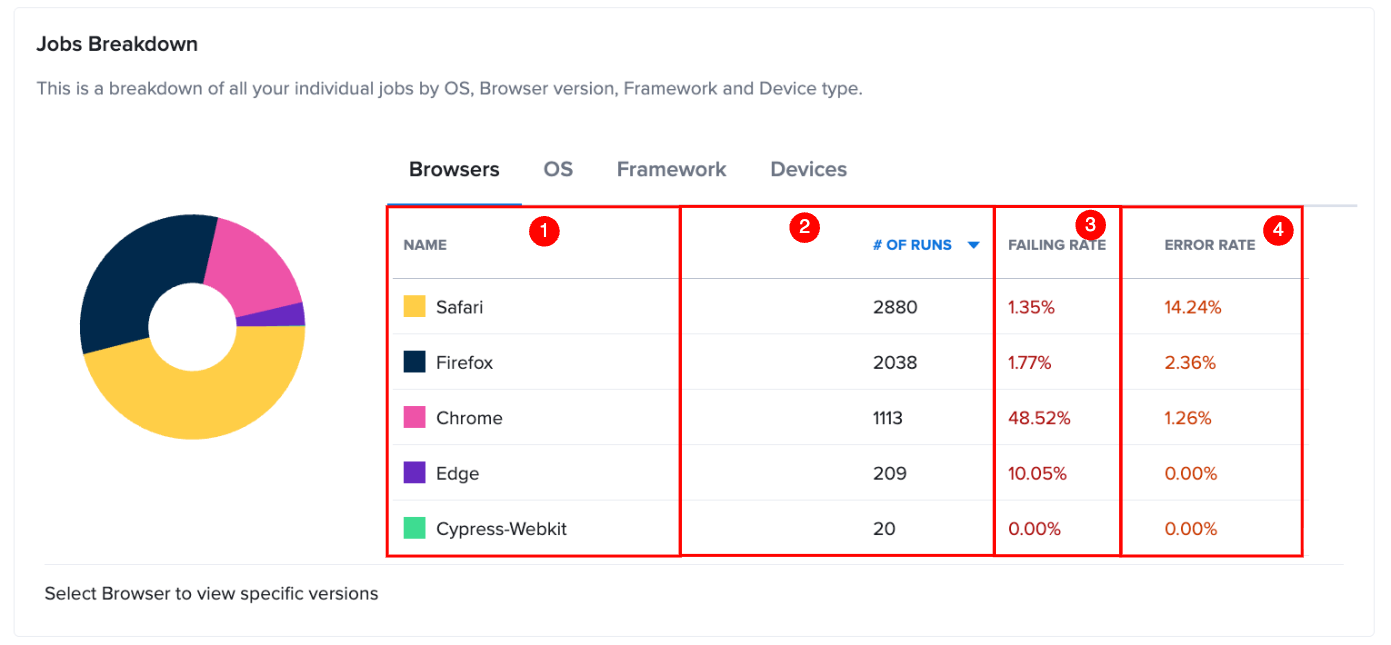
For each category, the table displays the following metrics:
| Ref. | Metric | Description |
|---|---|---|
| 1 | Name | The name of the browser, operating system, framework, or device. |
| 2 | # of Runs | The total number of job executions for the selected item. |
| 3 | Failure Rate | The percentage of job executions that resulted in a failed status. |
| 4 | Error Rate | The percentage of job executions that ended with an execution or infrastructure-related error. |
Read more about how your testing strategy might benefit from our Virtual and Real device clouds to ensure proper coverage across your user base.