Getting to know Sauce Home
Sauce Home is your AI-powered hub. It provides real-time analytics and actionable insights from test data, helping Engineering and Quality teams swiftly address issues, accelerate delivery, and boost product quality and customer satisfaction.
Accessing Sauce Home
Not only is Sauce home now your landing page when logging into Sauce Labs, but it's the place you'll return to frequently check on your testing strategy and preformance regularly. You can access Sauce Home a few different ways.
- Click the Home tab in the left-hand navigation pane to return to Sauce Home.
- Click the Sauce Labs logo in the top left corner of your screen.
Setting the Scope of the Sauce Home page
Sauce Home allows you to filter your test data to surface what's most important to you. You can view data by organization, team, or individual in addition to customizing the date range for which the scope will apply. Use the filters at the top left of the homepage to set your frame of reference.
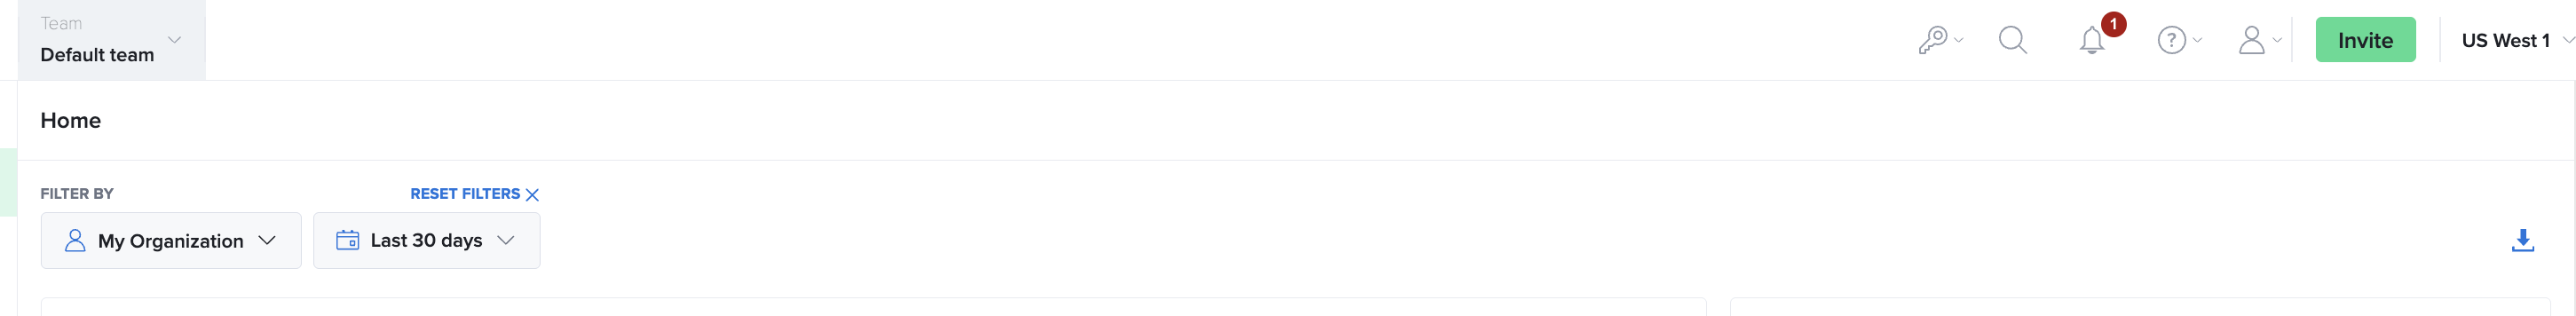
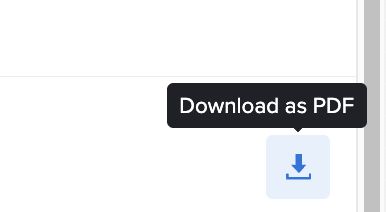
Exporting the Sauce Home page for sharing
Sauce Home is a great tool to share with your teammates. You can export the full page by clicking the small download arrow in the top right of the page to export to PDF.
Digging Into the Data With Widgets
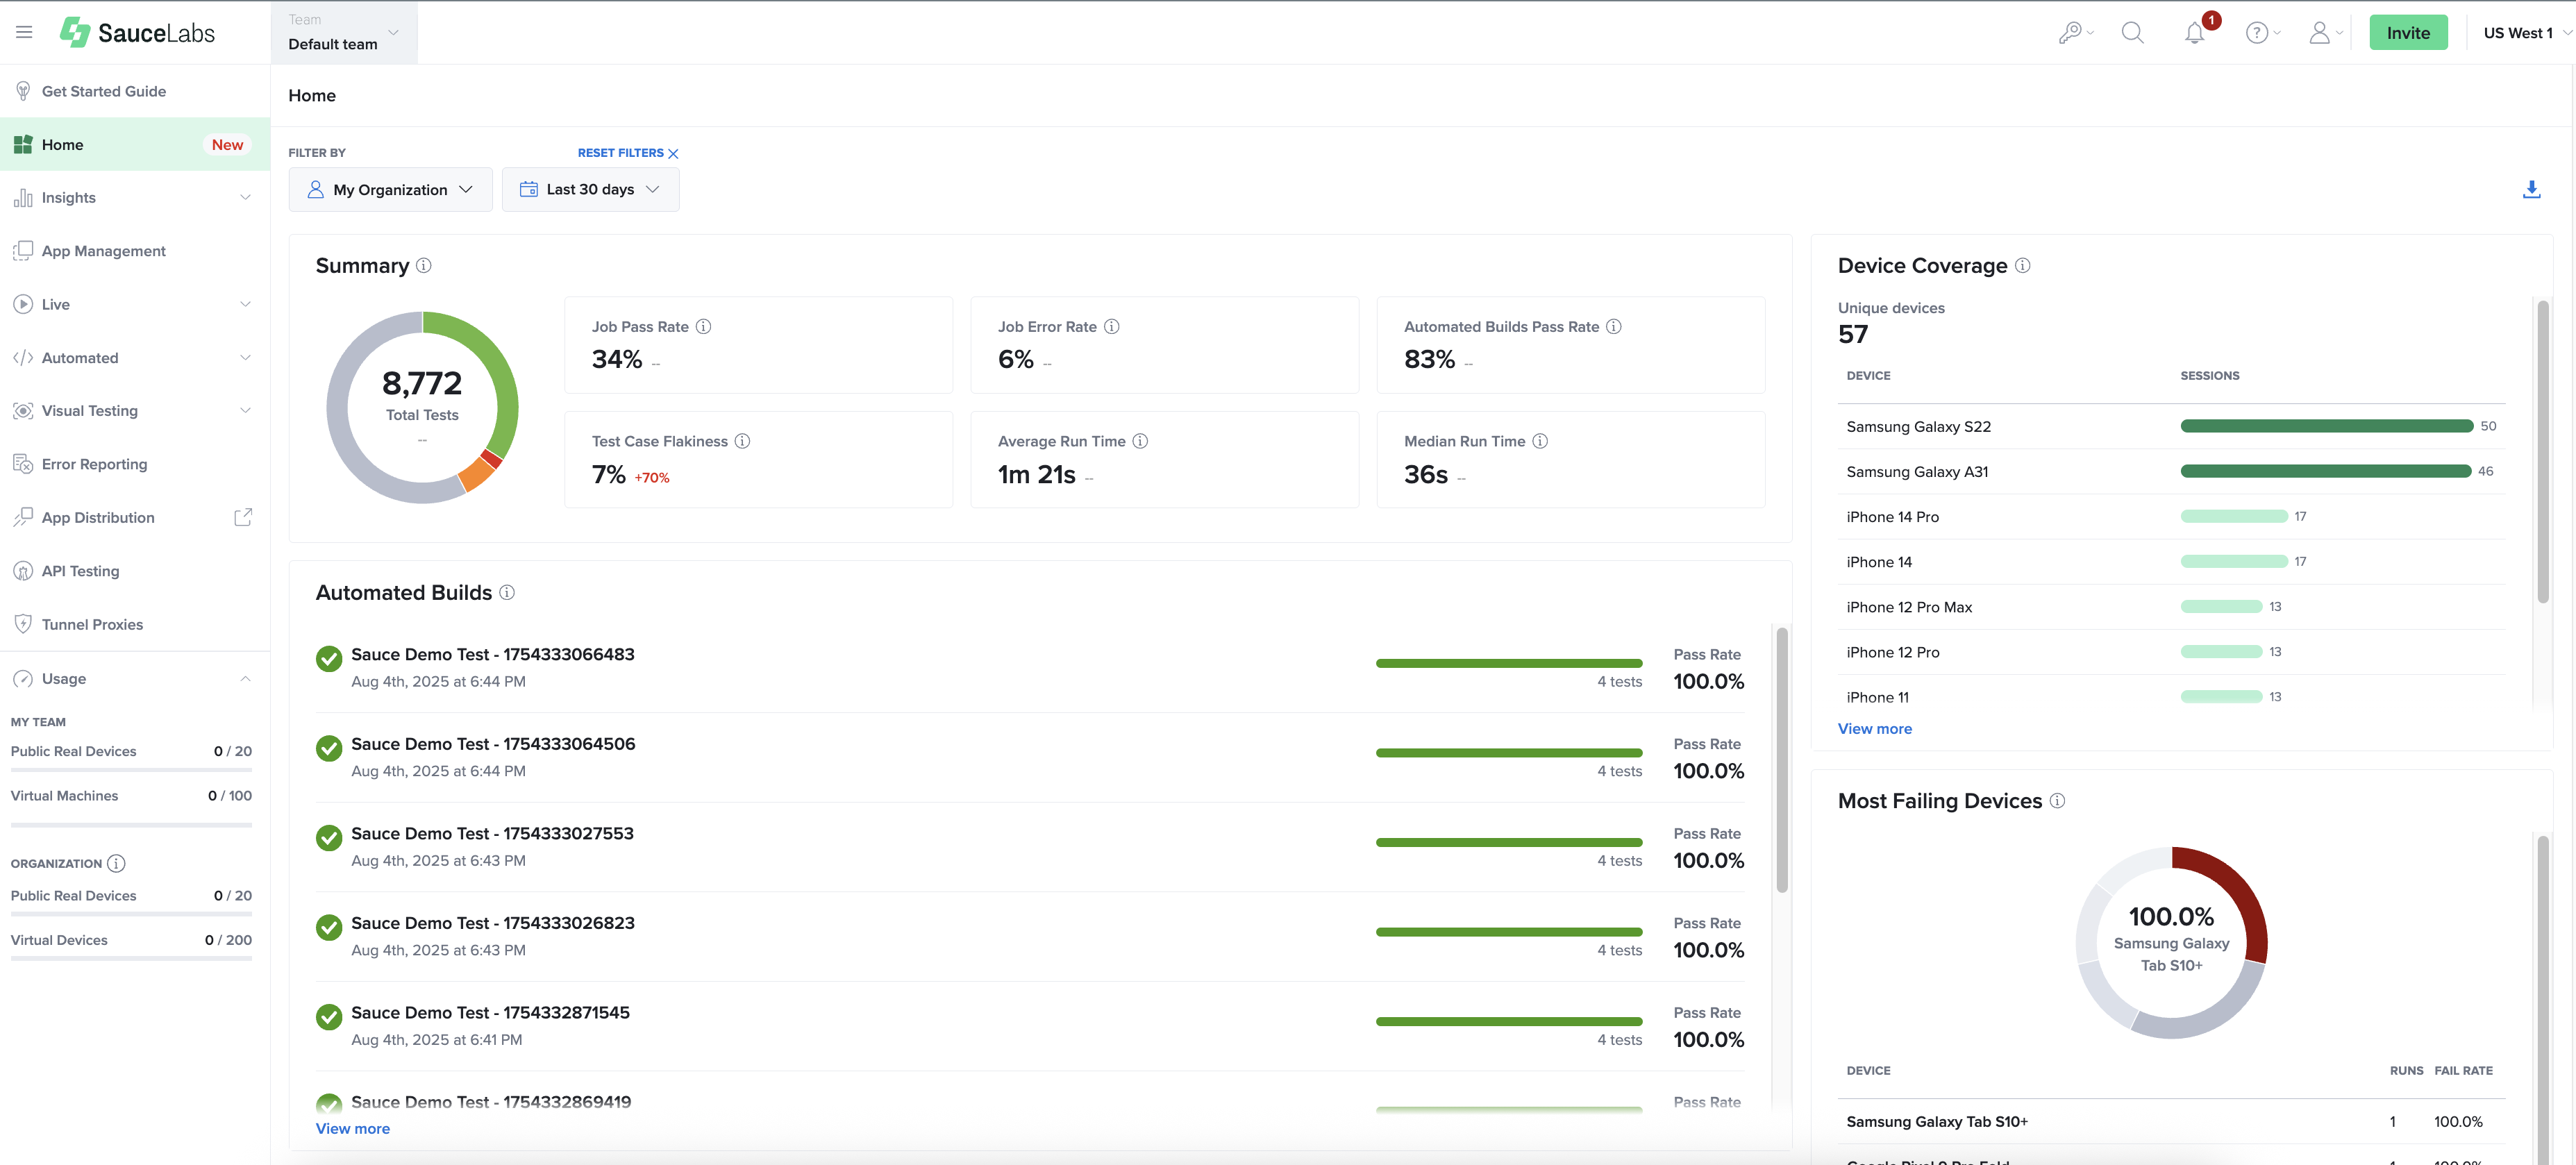
The Sauce Home page has numerous widgets to highlight the results and changes in your testing data that matter most to you.
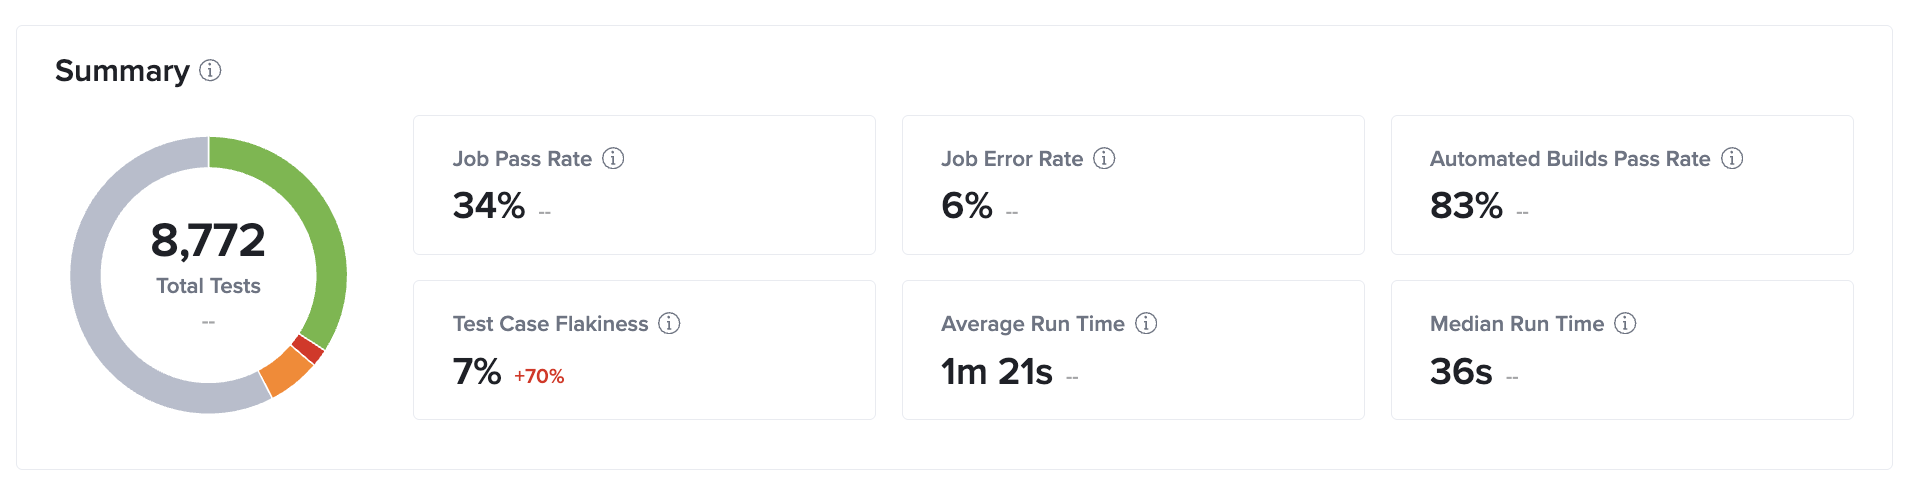
The Summary Widget
Summarizes key metrics in one place to streamline decision-making with metrics like pass and error rates that highlight when something needs your attention.
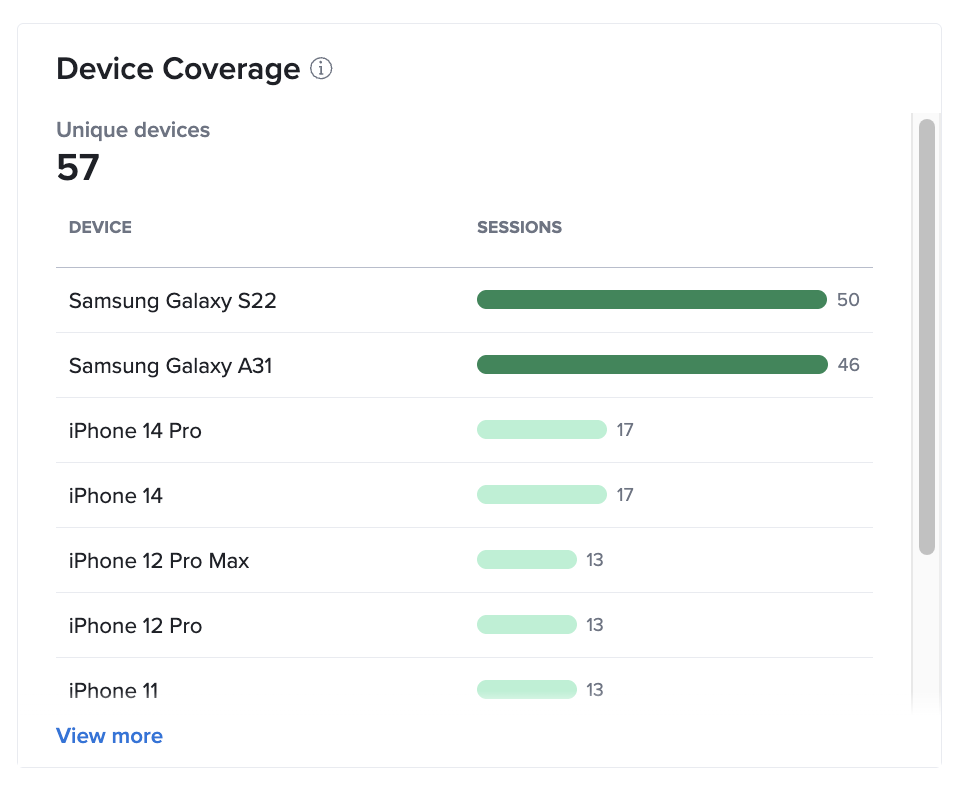
The Device Coverage Widget
Shows which devices you're testing against so you can align your testing practices with your user-base. Clicking view more at the bottom of the widget will take you to the expanded Device Coverage page.
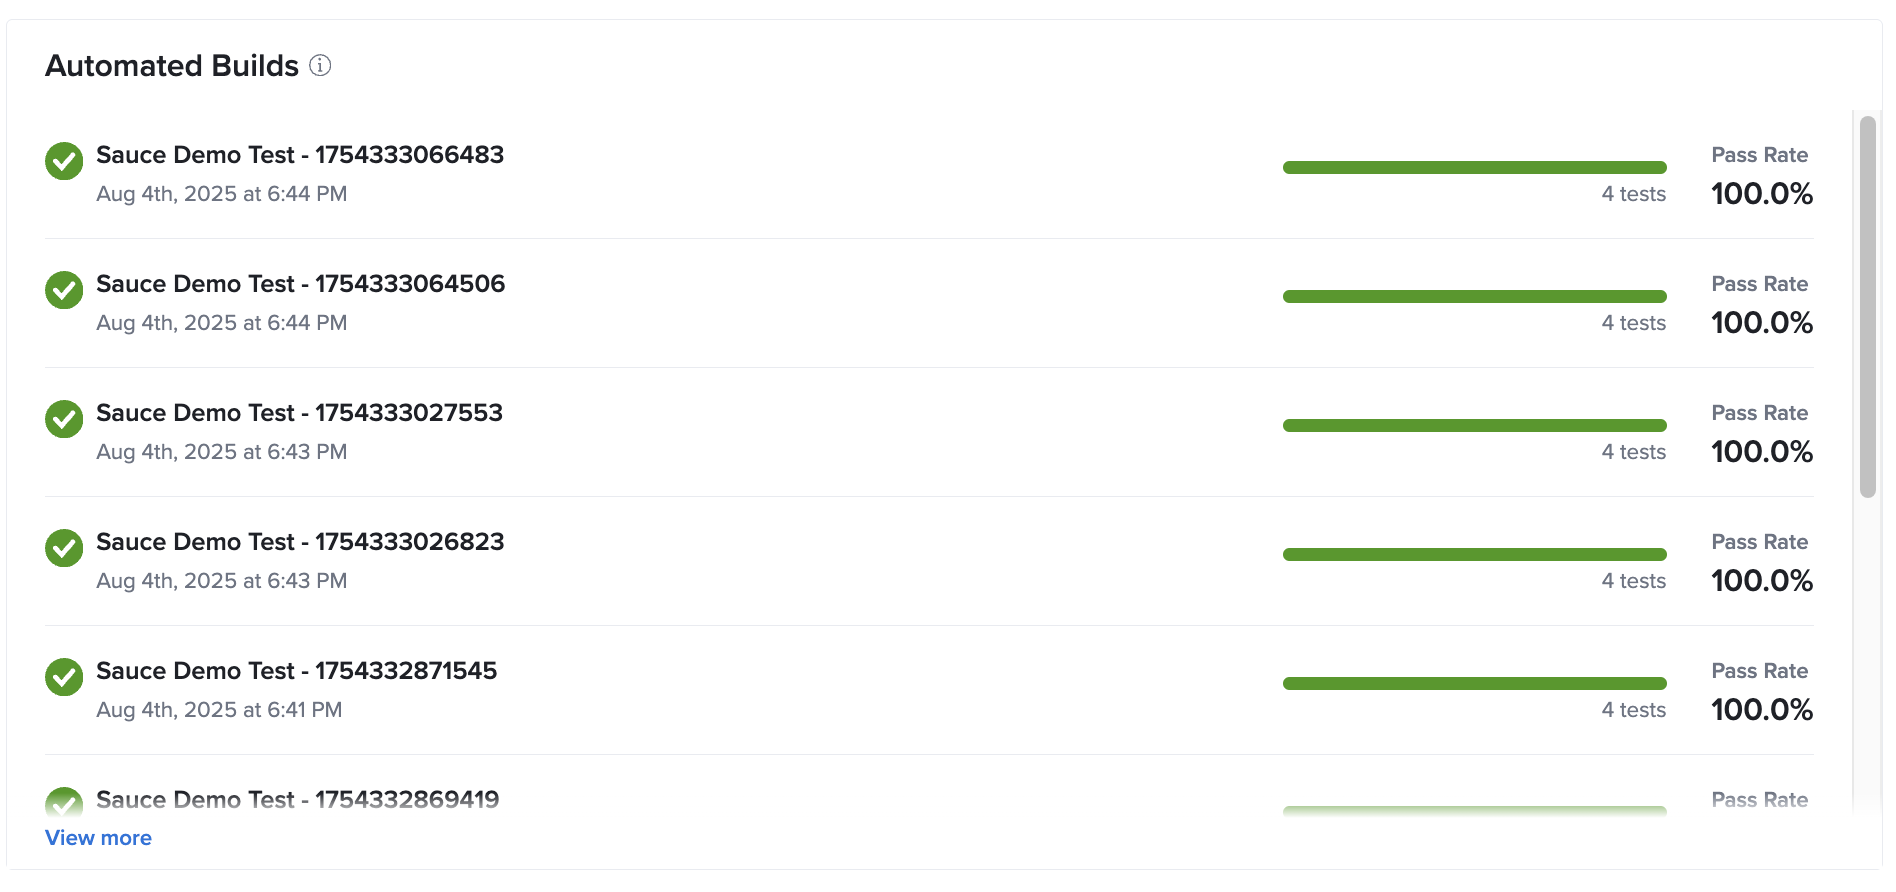
The Automated Builds Widget
Connects test results to builds to spot and understand performance and quality issues early in the testing process. Bulid details include pass rate and number of total jobs in each build. The automated Builds widget links out to the Builds page when clicking view more at the bottom of the widget.
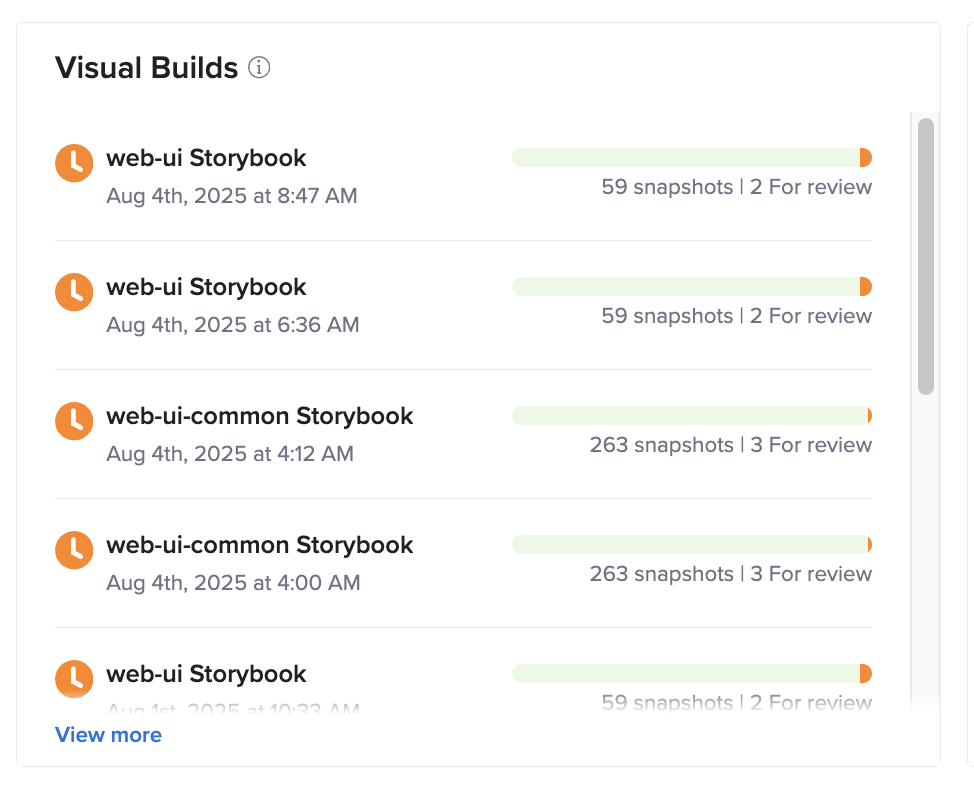
The Visual Builds Widget
Highlights your UI testing in a holistic picture to help you understand each build by surfacing total snapshots, diffs for review, and kick-off time. As above, clicking view more will take you to the expanded Visual Testing Builds page.
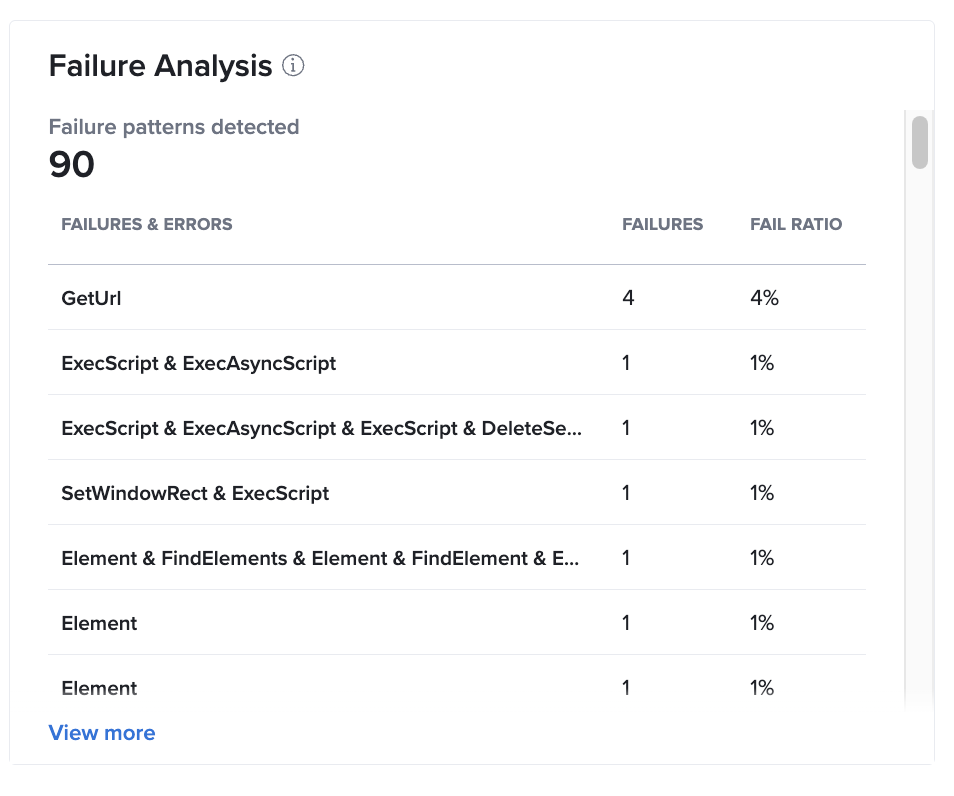
The Failure Analysis Widget
Surfaces the most pervasive failure patterns identified by custom pattern recognition to speed root cause investigations. Failure Analysis looks across all your tests, finds common failure patterns, and aggregates those patterns and jobs for your attention. View more will take you to the expanded Failure Analysis page where you can view the failure patterns and associated jobs that are affected by each pattern.
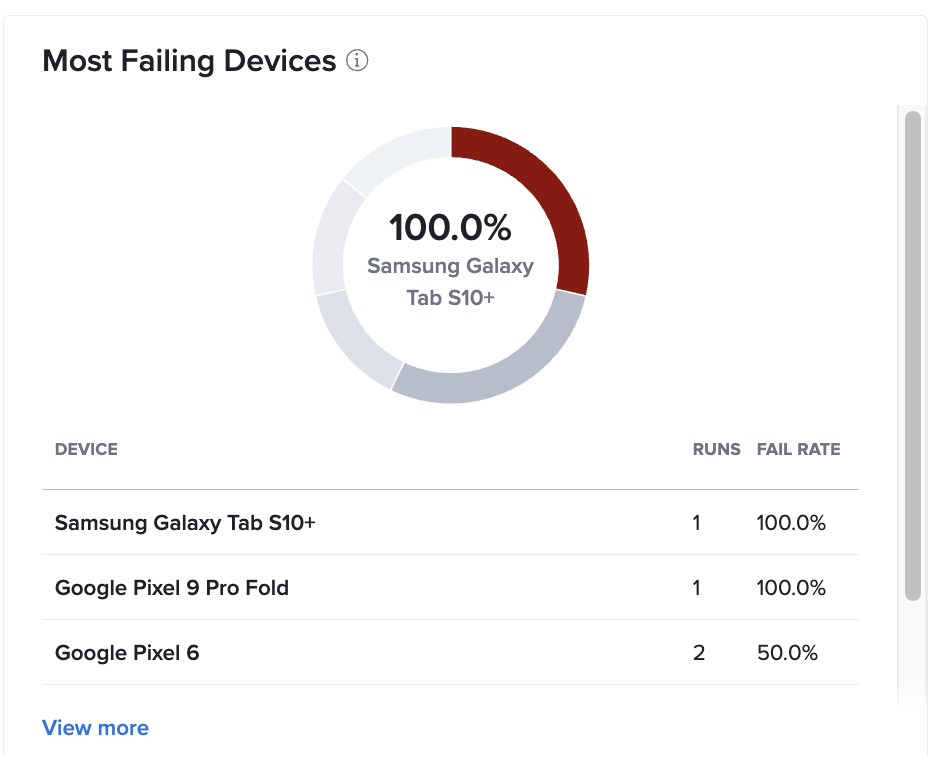
The Most Failing Devices Widget
Spots which devices are failing the most often and surfaces those devices with most failures to you. Clicking view more will take you to the Job History page with selected filters applied.