Error Reporting MCP Tools
After connecting Error Reporting MCP to Claude Code, you can use natural-language prompts to explore your Error Reporting data and investigate errors.
You can start with a broad request and progressively drill down into a specific error.
Before you begin, make sure Error Reporting MCP is connected. See Set Up Error Reporting MCP with Claude Code.
List your Error Reporting Projects
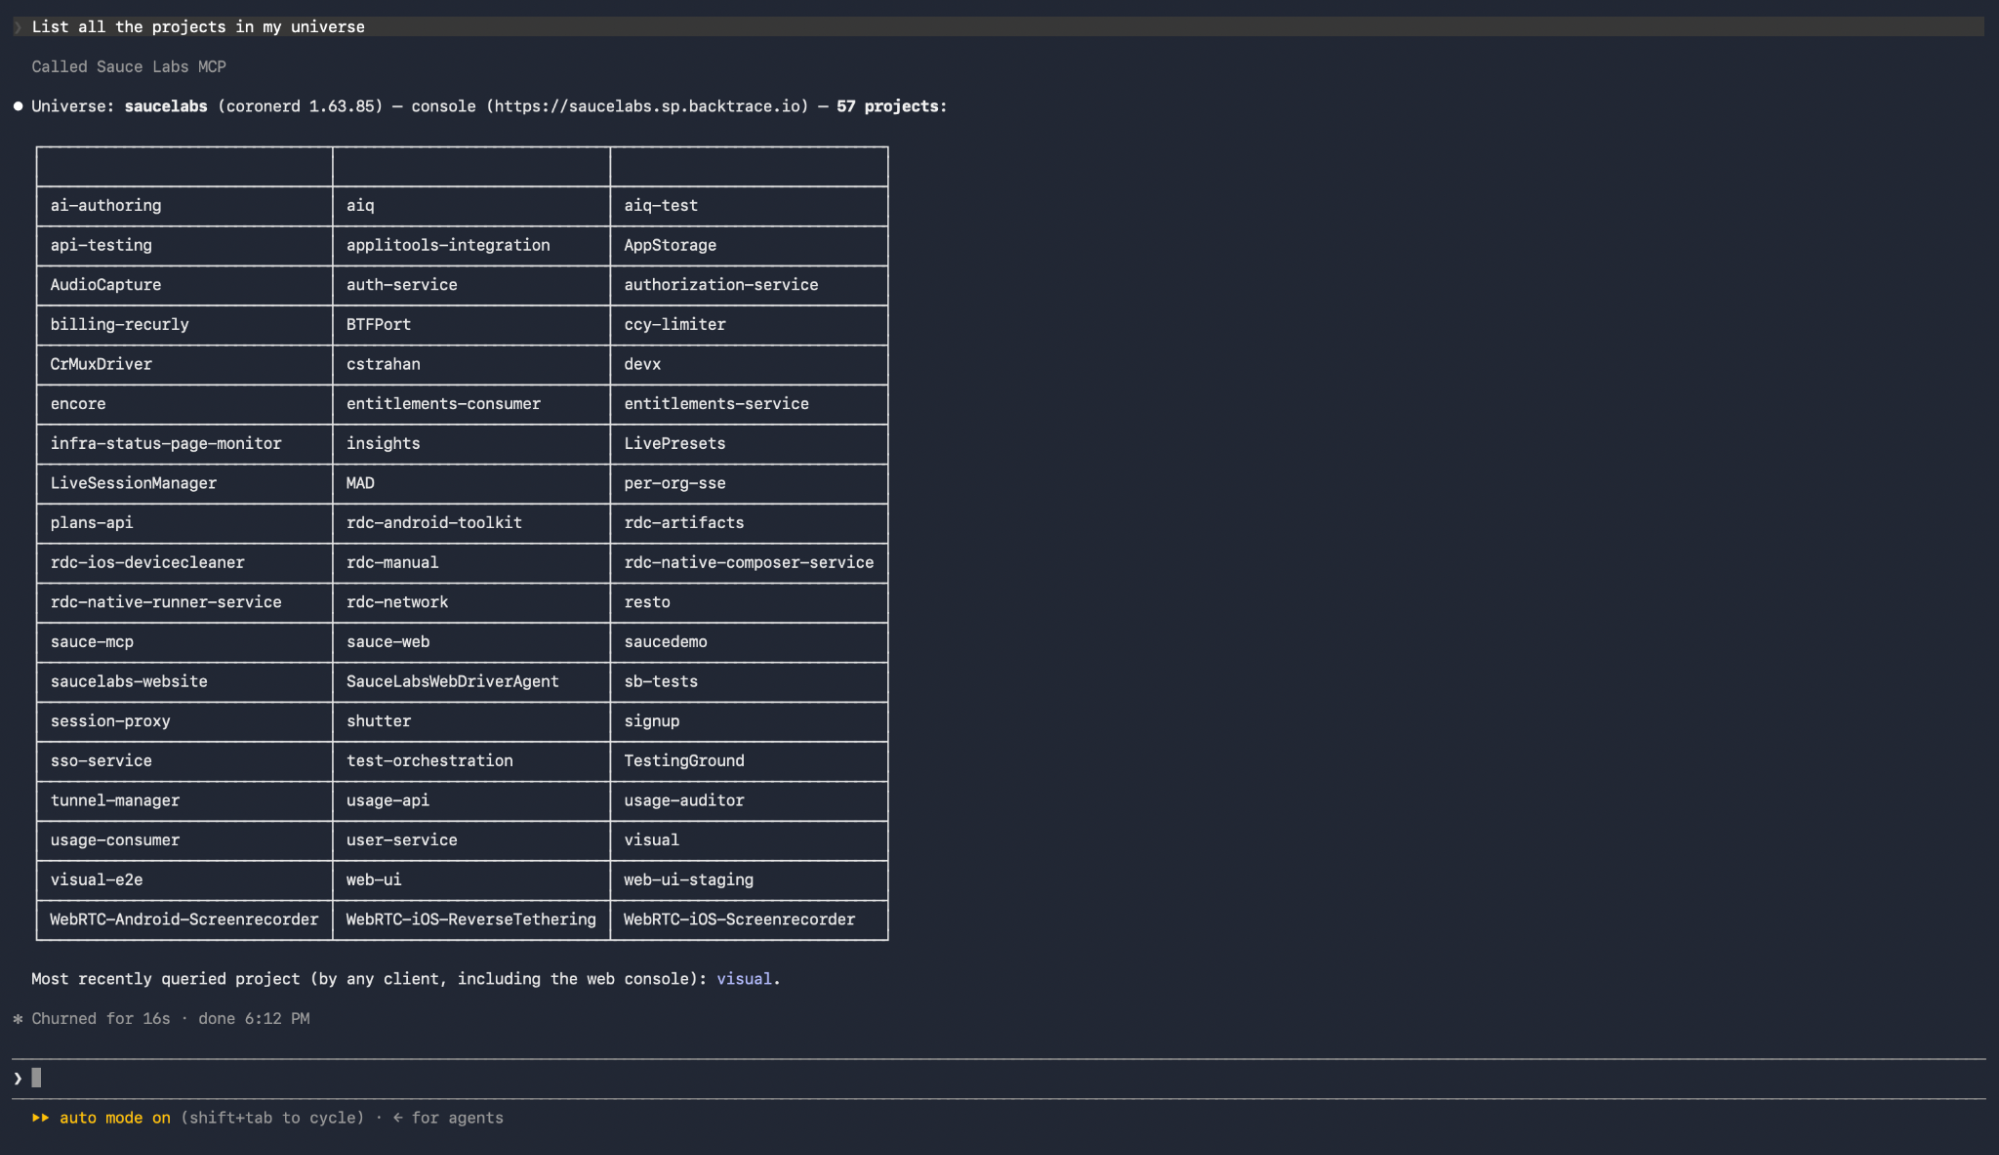
Start by viewing the projects available in your Error Reporting universe. Enter the following prompt in Claude Code:
List all the projects in my universe.
Claude Code uses Error Reporting MCP to retrieve the projects available in your universe.
Find the Top Errors in a Project
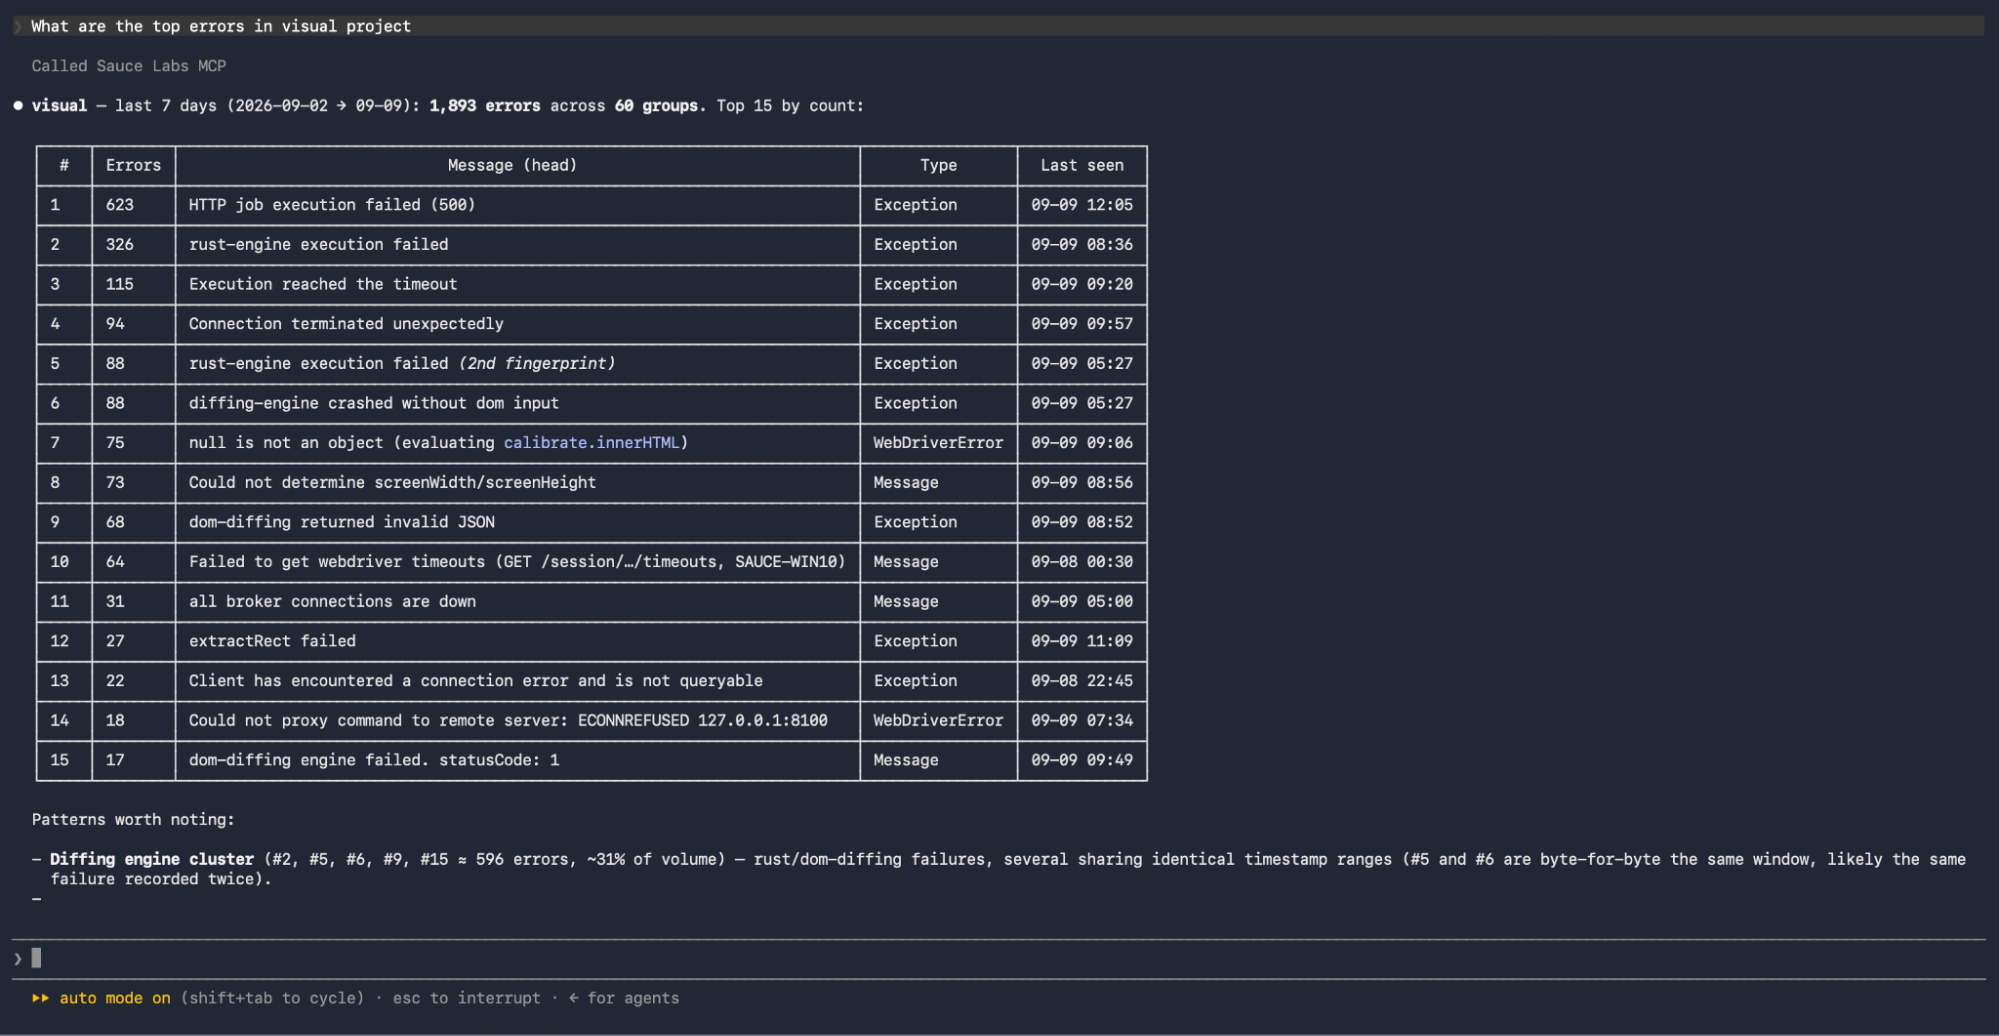
After identifying a project, ask Claude Code to find the most frequent errors for a specific time period.
For example:
What are the top errors in <project>?
Claude Code returns the top errors for the project, including information such as the number of errors, error message, type, and when the error was last seen.
You can use this information to identify the errors that may require further investigation.
Investigate an Error in Detail
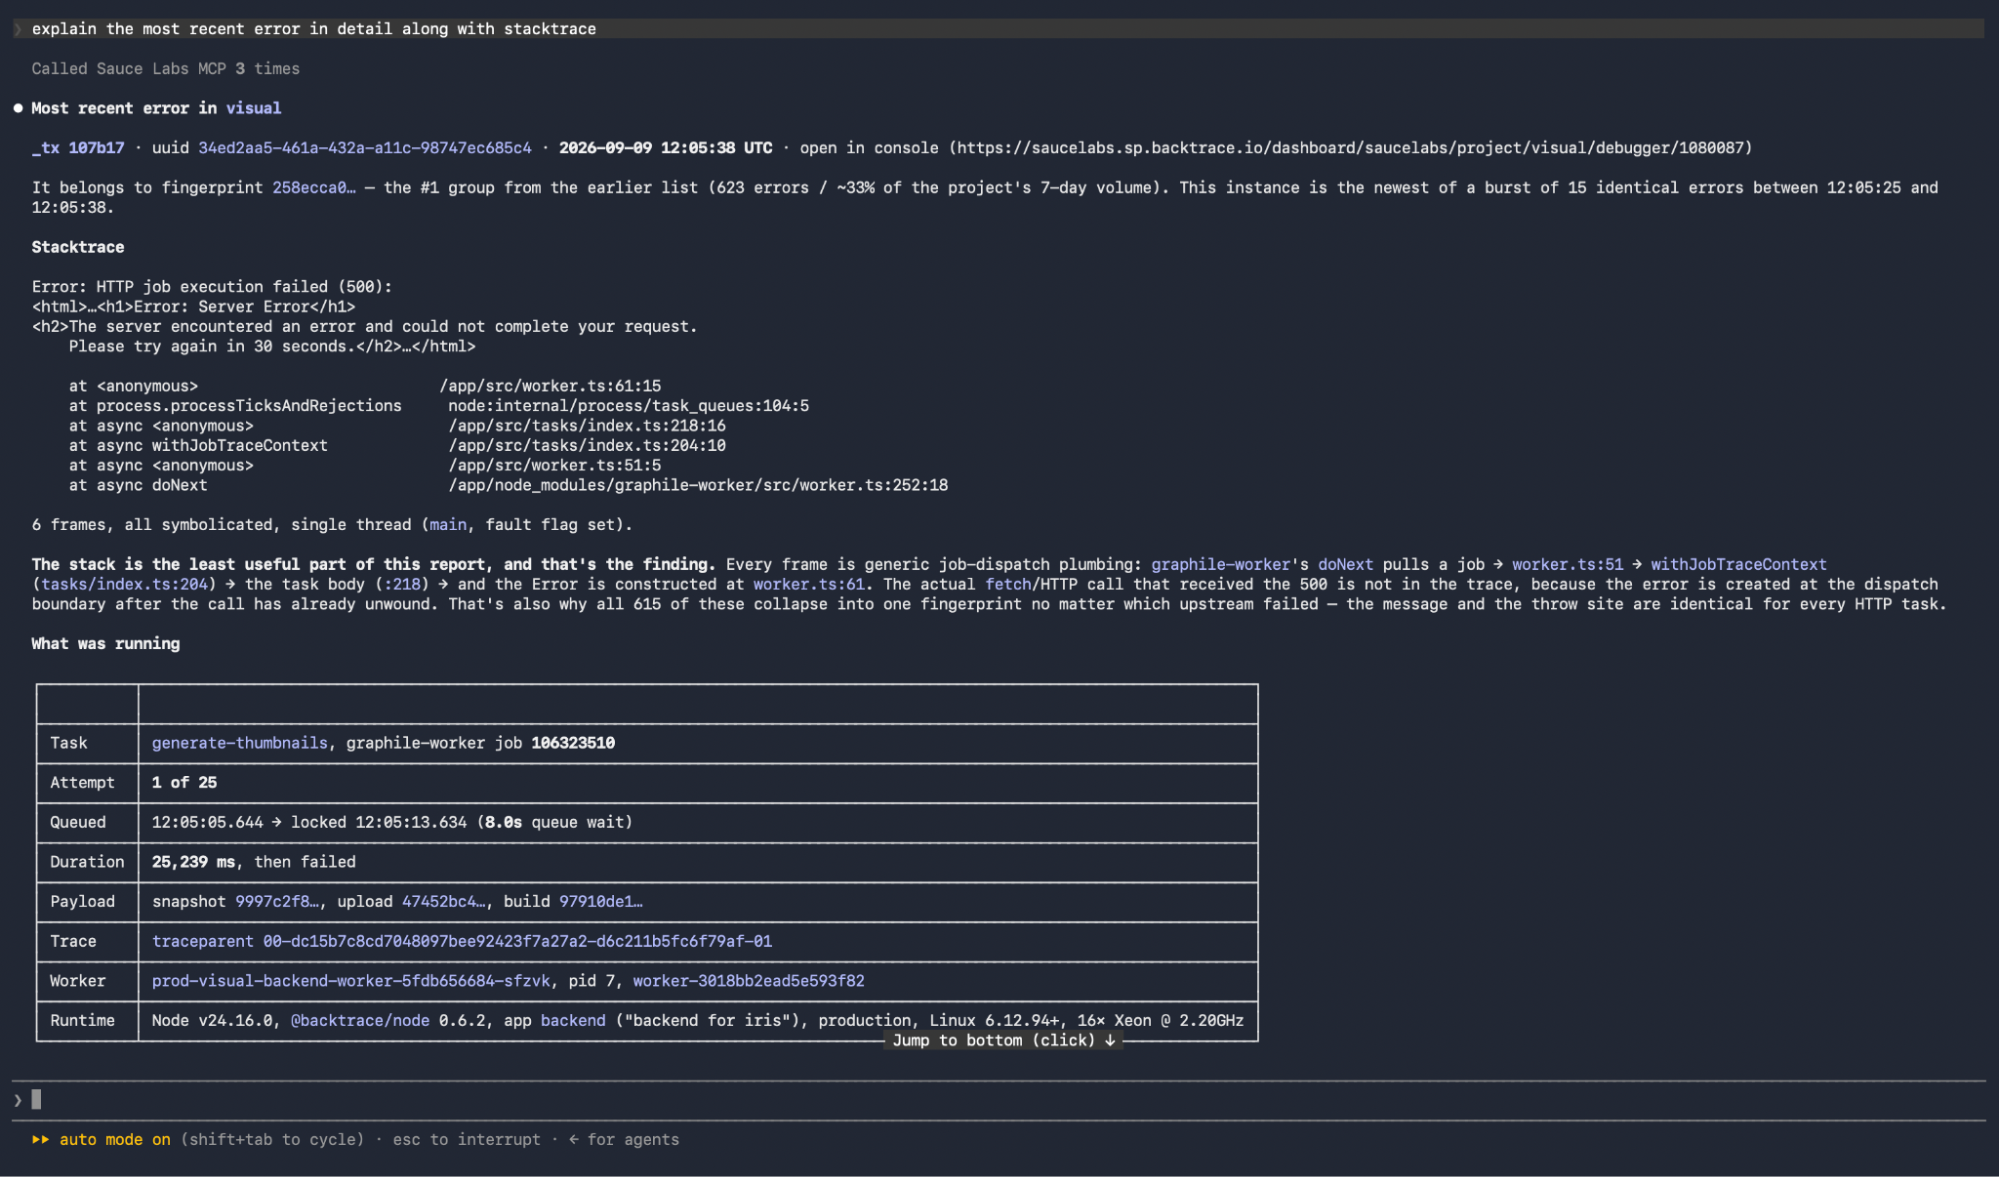
After identifying an error, ask Claude Code to investigate the error and provide its stack trace.
For example:
Explain the most recent error in detail along with stacktrace.
Claude Code retrieves the most recent error and provides details such as the error message, stack trace, associated error group, and information about the environment in which the error occurred.
MCP Tools
Error Reporting MCP provides tools for exploring Error Reporting projects, finding errors, and investigating crash details. The tools can be used together to progressively investigate an issue, starting with your available projects and narrowing down to an individual error and its supporting data.
| Tool name | Description | Example prompt |
|---|---|---|
error_reporting_get_context | Returns the caller's environment: universe and the projects the authenticated account can see. Call first in a session to resolve which project subsequent queries target. | "What Error Reporting projects do I have access to?" |
error_reporting_list_attributes | Lists the attributes available on a project—the fields a query can filter, group, or fold on. Call before constructing any filtered or grouped query so filters use real attribute names. | "What attributes can I filter on in the <project> project?" |
error_reporting_list_groups | Returns crash groups for a project over a time window, ranked with error counts, first/last seen, and affected users. The entry point for "what's broken right now." | "Show me the top 10 crash groups in <project> over the last 7 days, ranked by affected users." |
error_reporting_list_instances | Returns individual error objects, one row each, with selected attribute columns. Use when raw events matter rather than the aggregate—for example, slicing by version, device, or user. | "List every error in <project> from the last 24 hours on app version 5.2.1." |
error_reporting_get_group | Returns a single crash group in depth, beyond what the ranked list carries. Use after list_groups to investigate one group. | "Give me the full detail on crash group <group id> in <project>." |
error_reporting_get_instance | Returns one error object in full: the crashing thread's callstack, its attributes, and the attachments available on it. The main triage tool. | "Show me the callstack and attributes for error <object id> in <project>." |
error_reporting_get_attachment | Fetches one file attached to an error object—most usefully the SDK breadcrumbs. Call after get_instance surfaces the attachment list. | "Pull the breadcrumbs attachment for error <object id> and tell me what the user did in the seconds before the crash." |