Track Test Errors
Use the Errors page to monitor test errors, identify recurring issues, and understand how errors change over time. The Errors page combines error trends with a breakdown of the most pervasive errors, allowing you to focus on the issues that have the greatest impact on your test executions.
The page uses the selected filters to determine which test errors are included in the visualizations and error breakdown. By narrowing the data to a specific platform, operating system, framework, device, build, owner, or other test metadata, you can analyze errors in a specific testing context.
Access Error Rate Chart
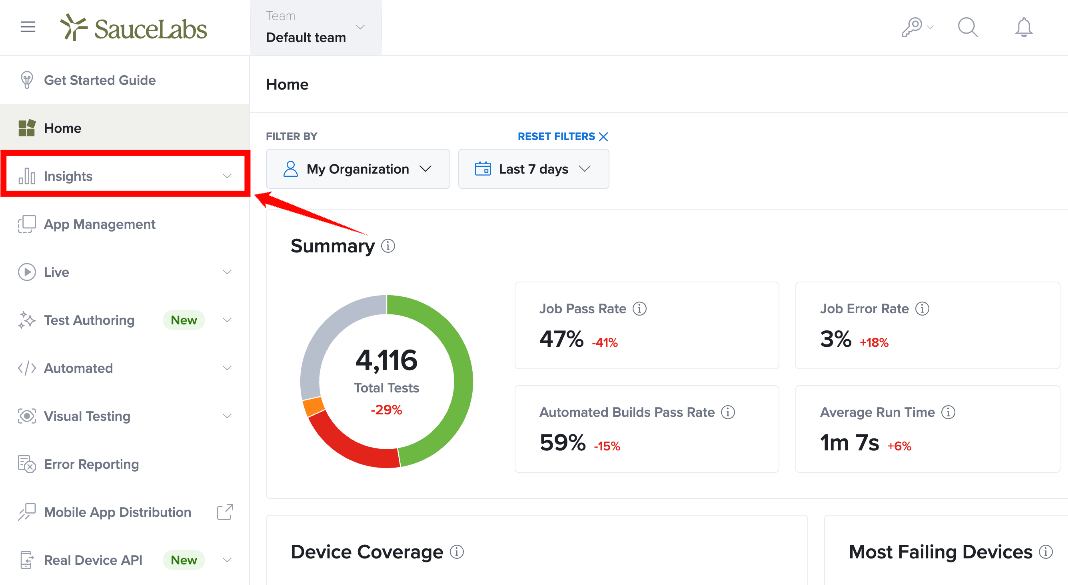
Step 1: Sign in to your Sauce Labs account. From the left-side navigation menu, select Insights to expand the available options.
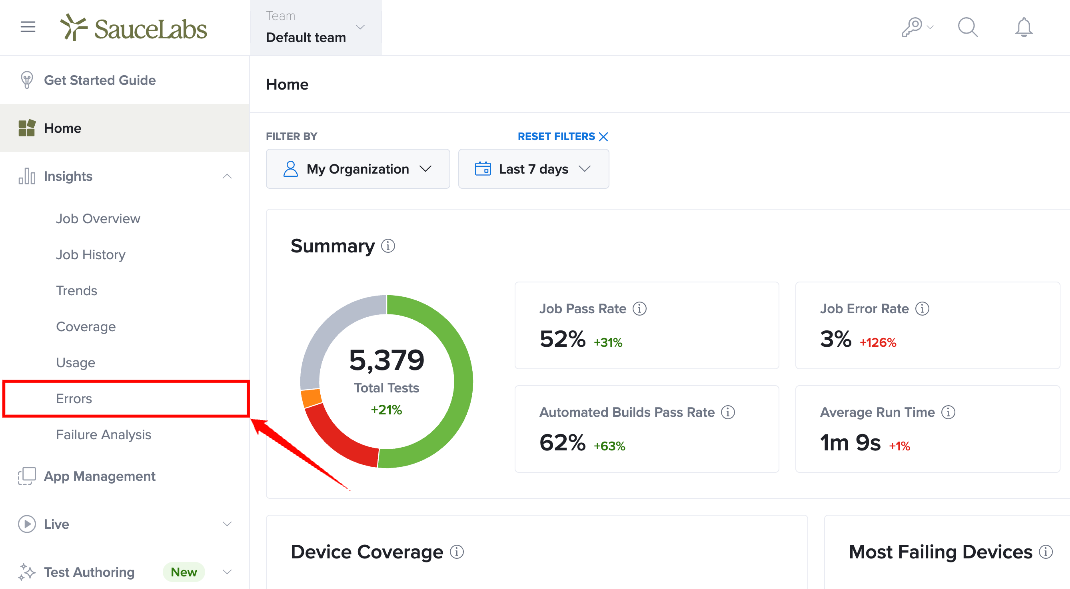
Step 2: From the expanded Insights menu, select Errors.
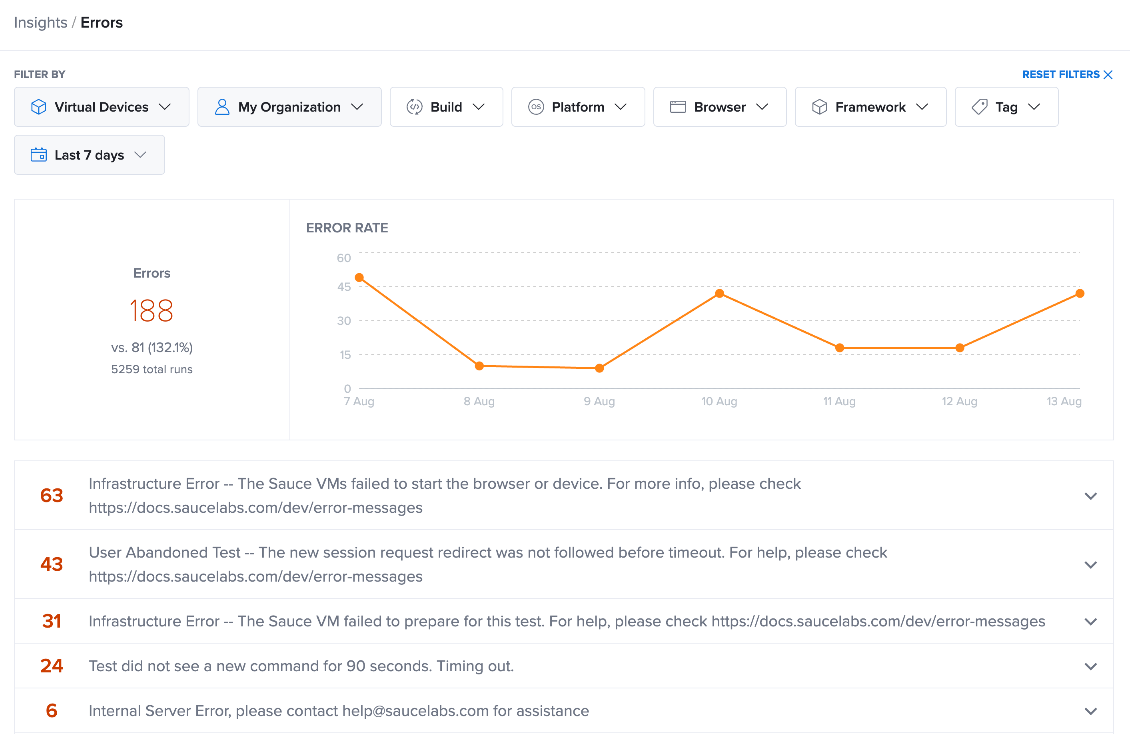
Step 3: The Errors page opens with the Error Rate chart and available error data, where you can use the filters to narrow the displayed results.
Error Rate Chart
The Error Rate chart provides a visual representation of test errors over the selected time period. Use the chart to identify changes in error volume, compare error activity across dates, and review the number of errors recorded at a specific point in time.
Error Summary
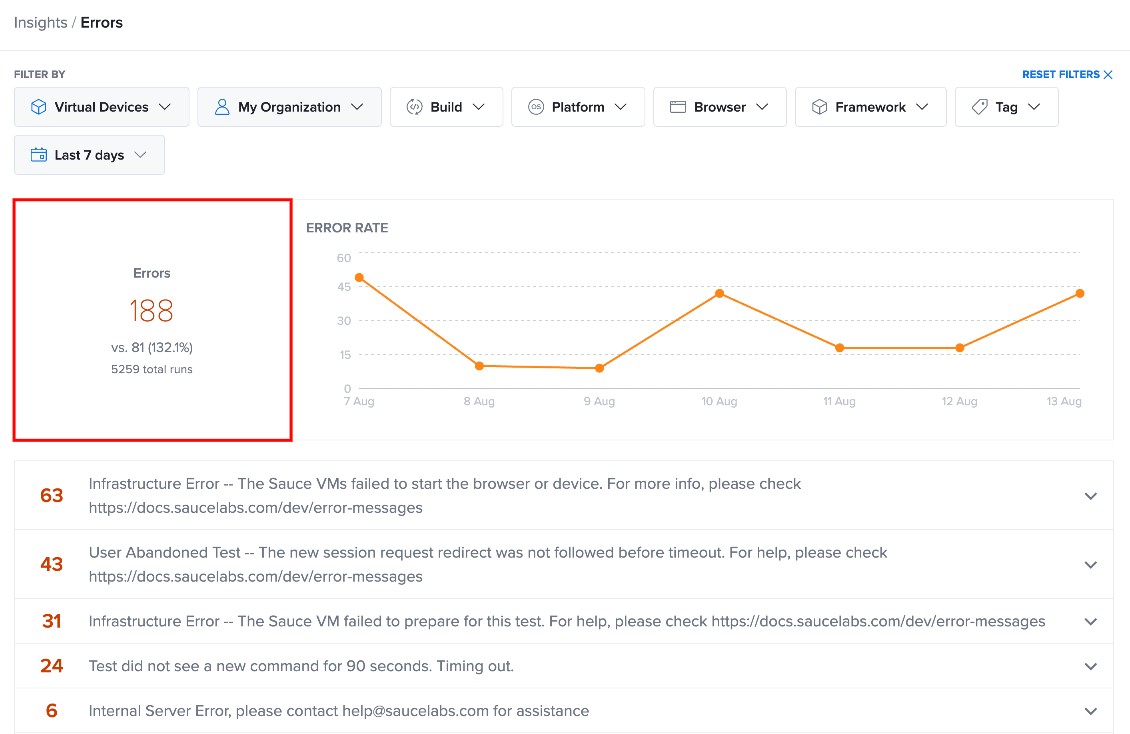
The summary displayed to the left of the chart provides an overview of the error data for the selected period.
-
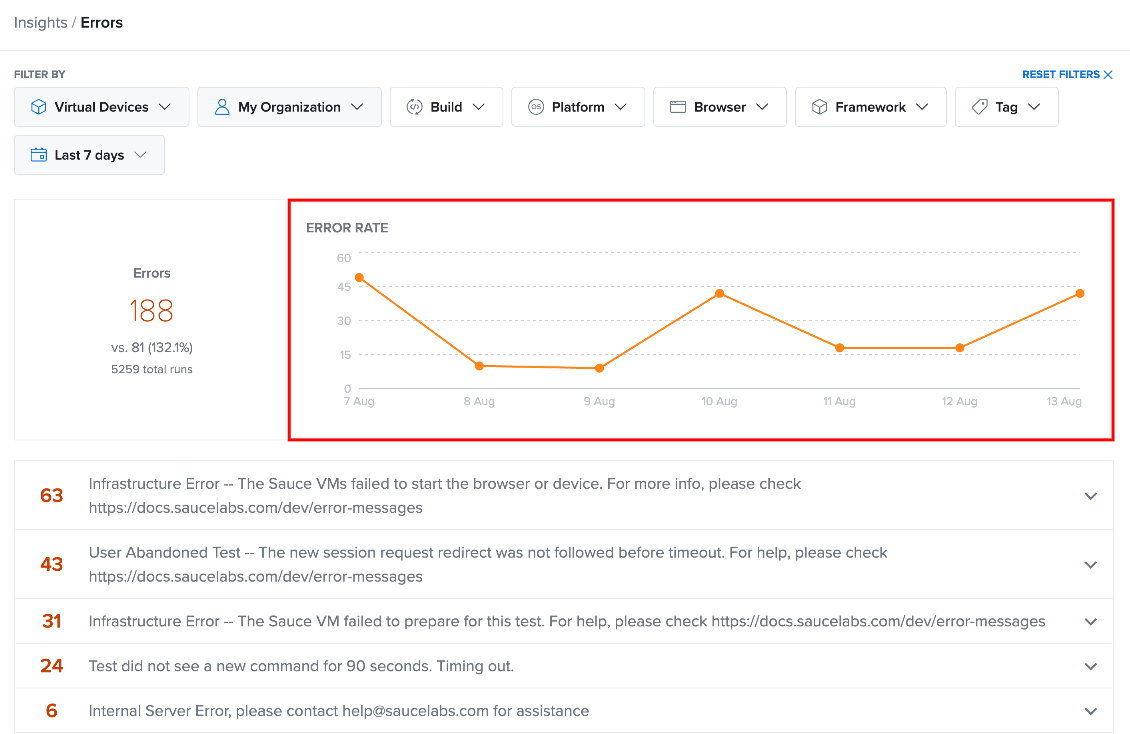
Errors: Shows the total number of errors recorded. In the example, the report shows 188 errors.
-
Comparison: Shows the difference compared with the previous period. In the example, 188 errors are compared with 81, representing a 132.1% increase.
-
Total runs: Shows the total number of test runs included in the data. In the example, the report includes 5,260 total runs.
Error Trend
The chart displays error activity across the selected dates. Each point on the line represents the number of errors recorded for that date.
The horizontal axis shows the dates included in the selected period, while the vertical axis represents the number of errors. The line connects the daily error values, making changes in error volume easier to identify.
For example, the chart shows error activity from 7 Aug through 13 Aug 2026. The number of errors decreases between 7 Aug and 9 Aug, increases on 10 Aug, and then decreases again before increasing on 13 Aug.
View Error Details
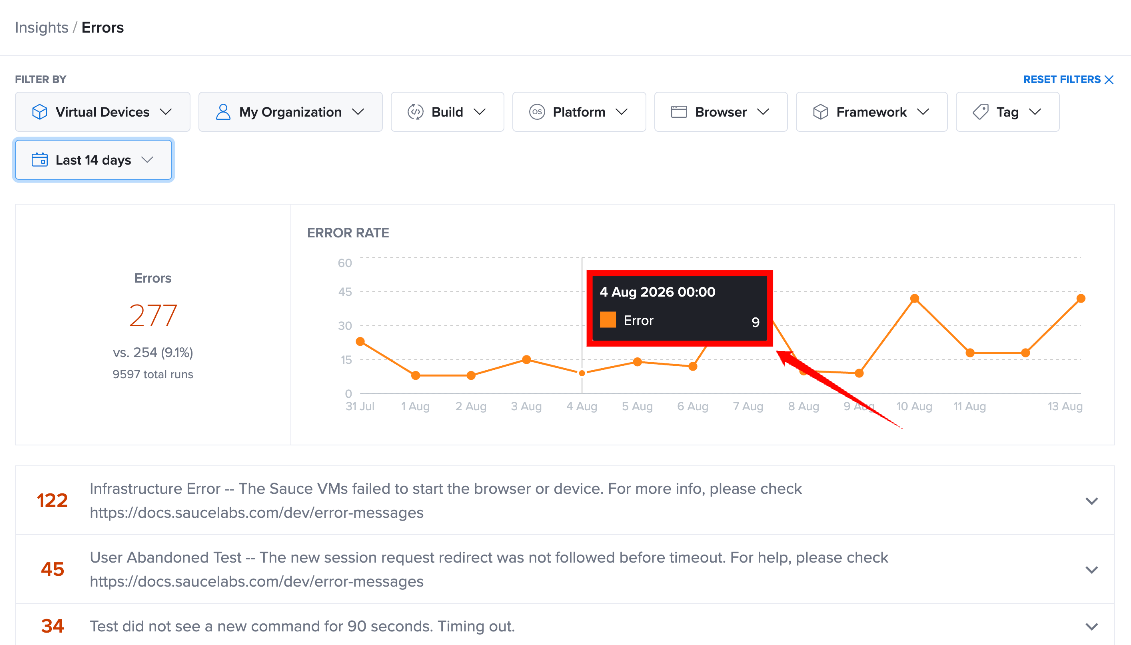
Hover over a point on the Error Rate chart to view the error count for that date.
The tooltip displays:
-
Date and time for the selected data point.
-
Error: The number of errors recorded at that point.
For example, hovering over 9 Aug 2026 00:00 displays Error: 9, indicating that 9 errors were recorded for that date.
Interpreting the Chart
Use changes in the line to identify periods with higher or lower error activity. A higher point indicates a greater number of errors for that date, while a lower point indicates fewer errors.
The chart can help you:
-
Identify dates with unusually high error activity.
-
Compare error volume across the selected period.
-
Track whether error activity is increasing or decreasing.
-
Use specific dates as a starting point for further investigation of the errors listed below the chart.
Error Breakdown
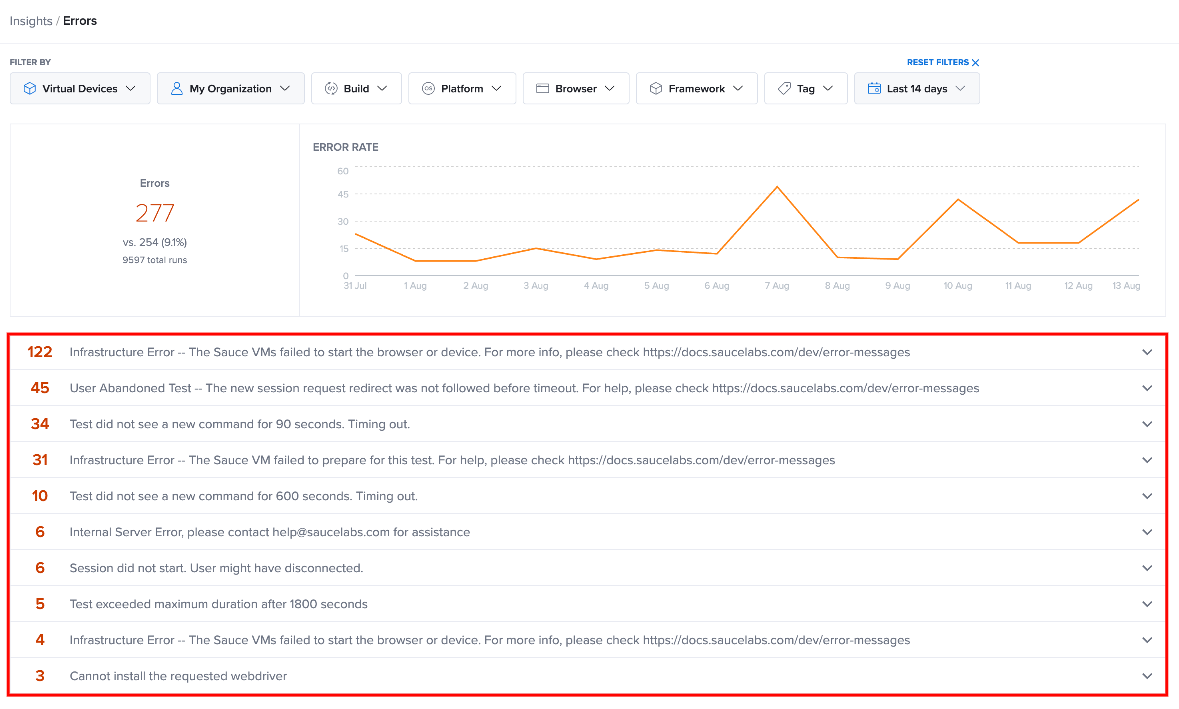
The Error Breakdown provides a detailed view of the errors recorded for the selected filters and time period. Each error is grouped by its error message and displays the number of occurrences, allowing you to identify which errors are occurring most frequently.
Errors are listed in descending order by occurrence. This makes it easier to prioritize errors that affect the largest number of test executions.
Error Occurrence
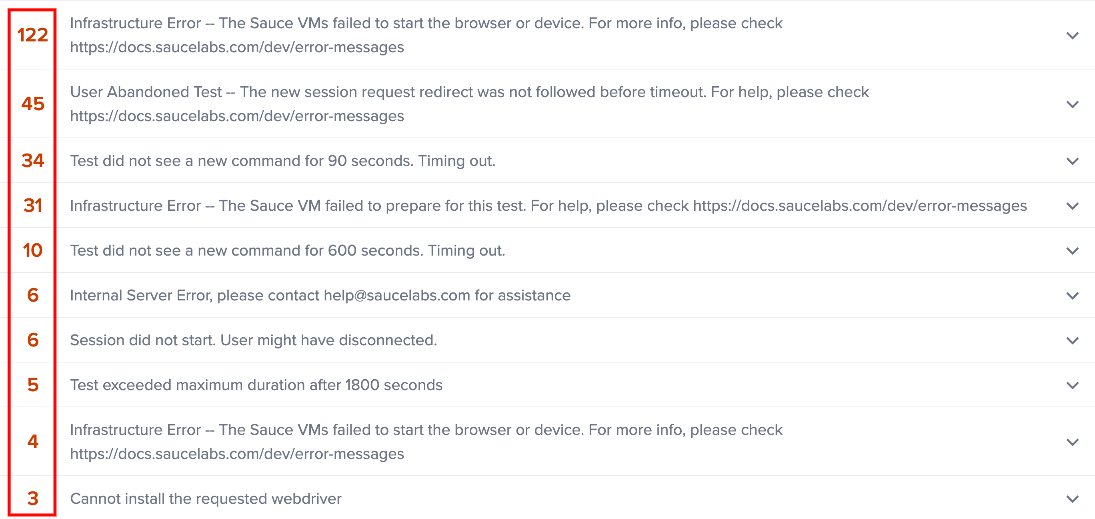
The number displayed next to each error represents how many times that error occurred in the selected data set.
A single error message can appear as a separate entry when it represents a different error condition or message. Reviewing the occurrence count helps determine whether an issue is isolated or recurring across multiple test executions.
Error Messages
Each entry displays the error message associated with the test execution. Error messages can provide information about the type of problem encountered during a test, such as:
-
Infrastructure errors when a Sauce VM cannot start or prepare the browser or device.
-
User abandoned test errors when a session request redirect is not followed before the timeout.
-
Command timeout errors when a test does not send a new command in the configured timeout period.
-
Server errors when an internal Sauce Labs server error occurs.
-
Session errors when a session does not start or the user disconnects.
-
Duration errors when a test exceeds its maximum allowed duraton.
-
WebDriver errors when the requested WebDriver cannot be installed.
The error message can also include a reference to additional error documentation when more information is available.
View Test Sessions
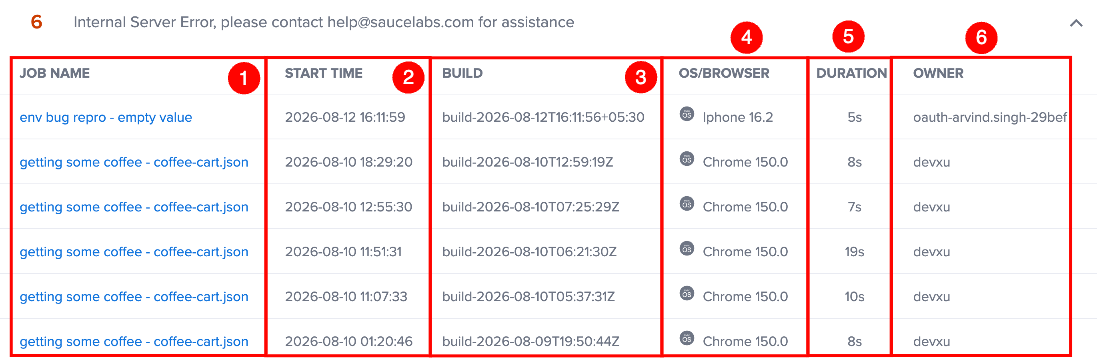
Expand an error to view the test sessions associated with that error. The expanded section provides information about the individual test executions that produced the selected error.
The available information includes:
| Field | Description |
|---|---|
| Job Name | Identifies the test job where the error occurred. |
| Start Time | Shows when the test execution started. |
| Build | Identifies the build associated with the test execution. |
| OS/Browser | Shows the operating system and browser used for the test. |
| Duration | Shows how long the test execution ran. |
| Owner | Identifies the user associated with the test execution. |
Debugging Pervasive Errors
Beneath the trend graph, Sauce Labs automatically groups and ranks the specific error messages returned. Instead of digging through thousands of individual test logs, you can use this list to identify the highest-impact issues:
-
Prioritize by Volume: The number on the left indicates exactly how many times that specific error occurred in your selected timeframe. Start with the most frequent errors to fix the largest number of failing tests at once.
-
Investigate the Root Cause: Expand any error in the list to read the full stack trace or error message.
-
Take Action: Click into the specific test sessions associated with an error to view video recordings, Appium/Selenium logs, and device vitals to pinpoint exactly what went wrong.
Best Practices for Error Analysis
-
Monitor new releases: After a major code merge or release, check the Errors page and filter by your most recent Build to ensure no new pervasive errors were introduced.
-
Clean up your test suite: Regularly check for "User Abandoned Test" or configuration timeout errors. These often point to inefficient test design or incorrect timeout capabilities in your script rather than a bug in your application.