Build and Job Statistics
The Build and Job Statistics section provides a detailed view of test executions for the selected time period. It allows you to review build information, monitor individual test jobs, and access detailed test results for further investigation.
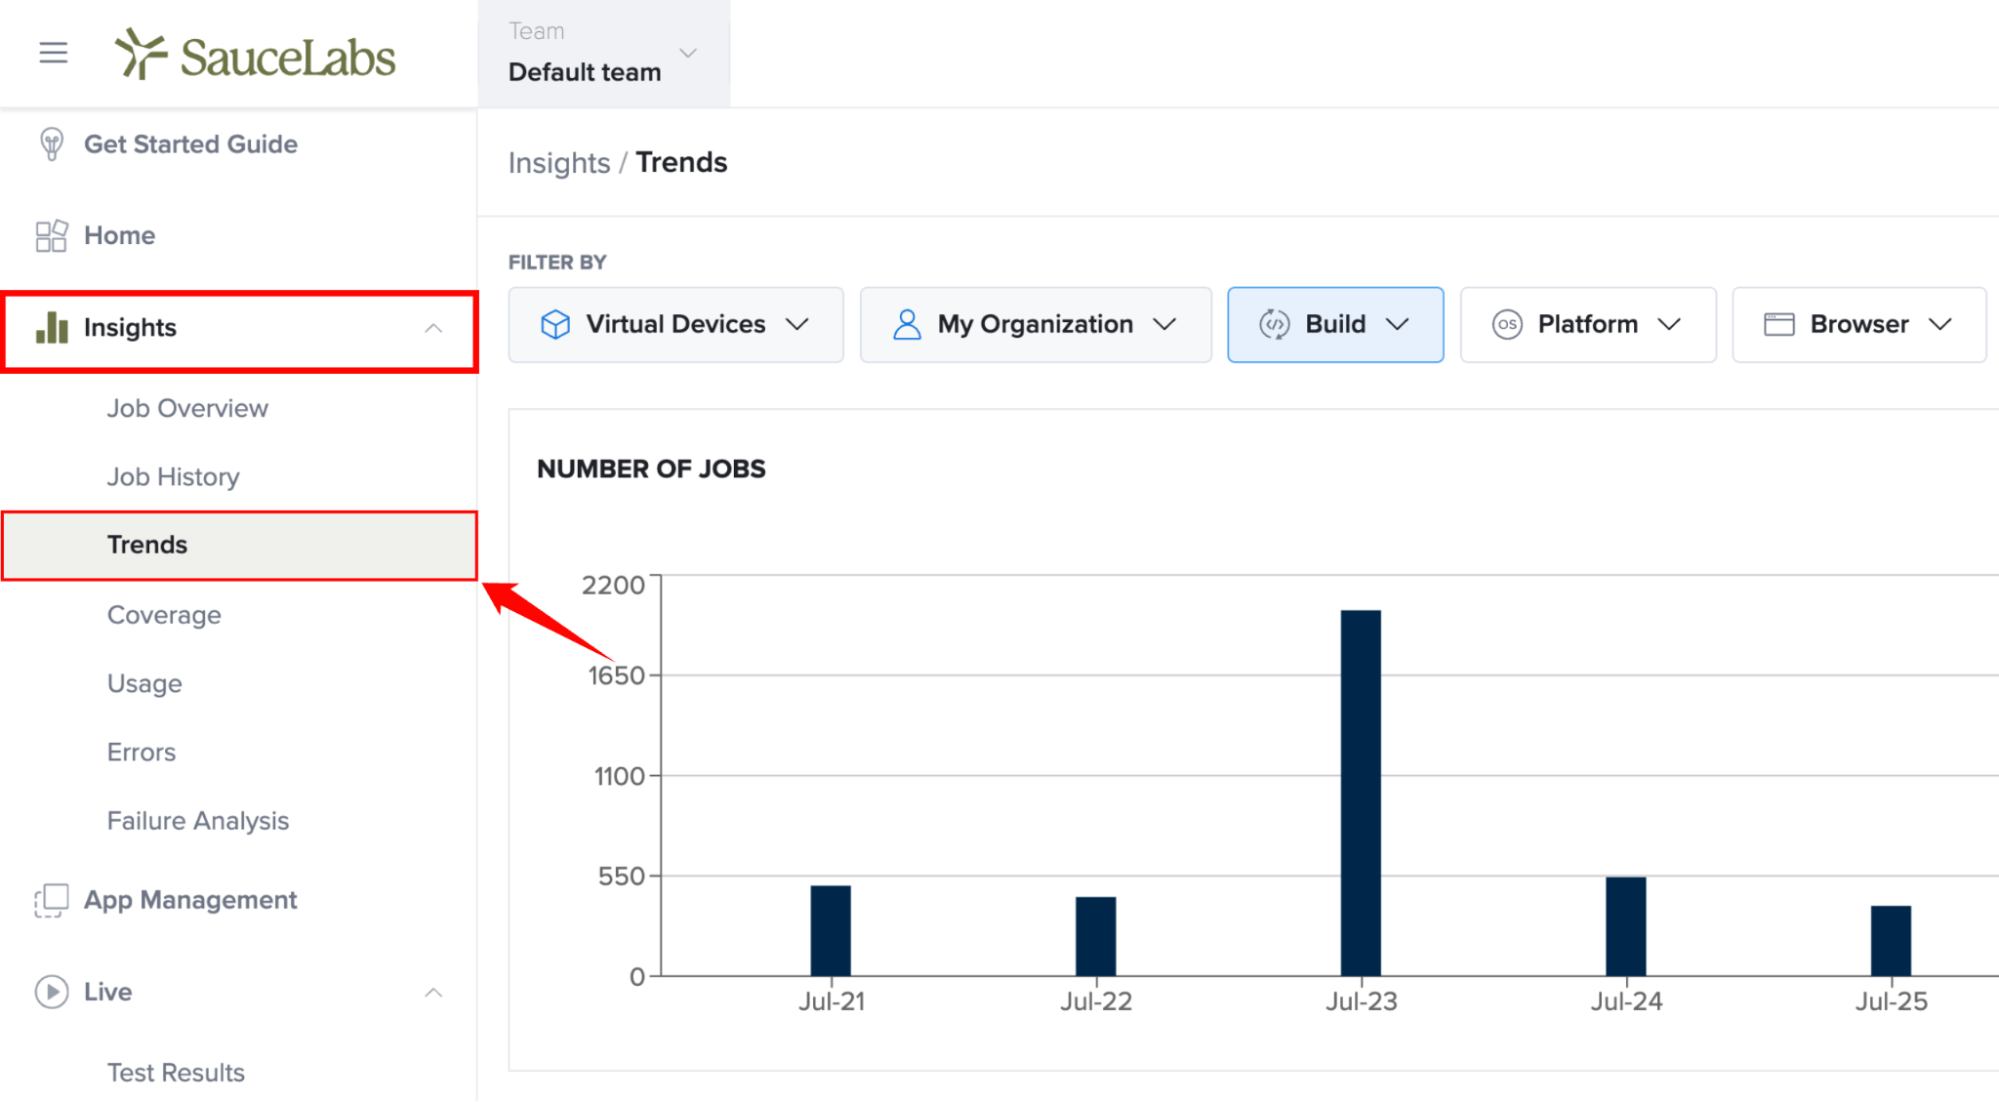
Step 1: Inside your Sauce Labs account, from the left-hand navigation menu, expand Insights, and then select Trends.
Step 2: Configure the filters to display the test results you want to analyse. For information about the available filters and how to use them, see Filter Controls for Trends.
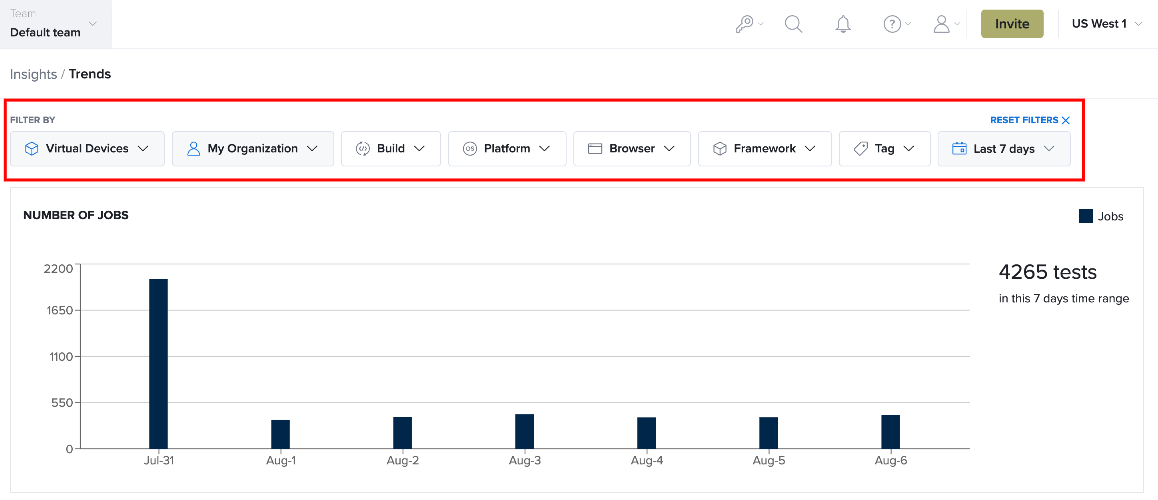
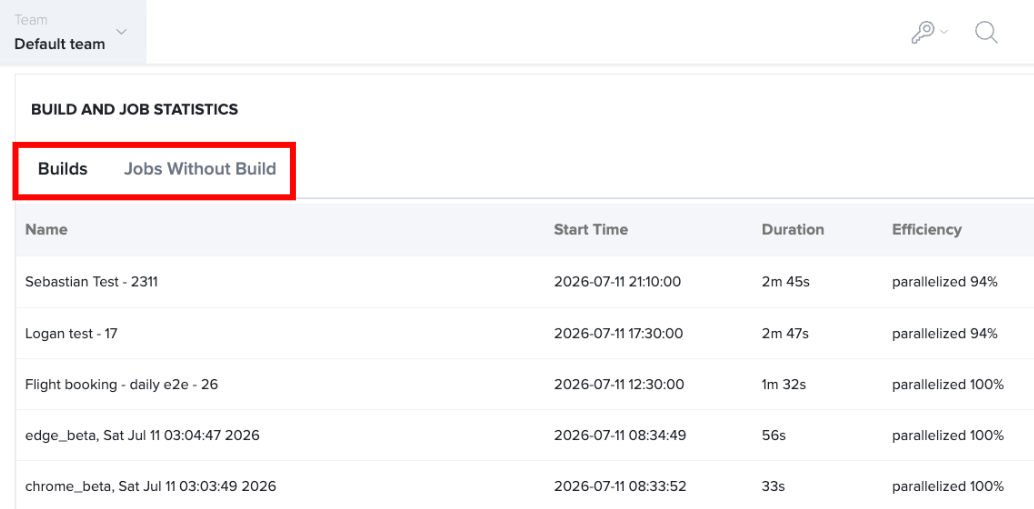
The Build and Job Statistics section displays the following tabs:
-
Builds
-
Jobs Without Build
Review Build Statistics
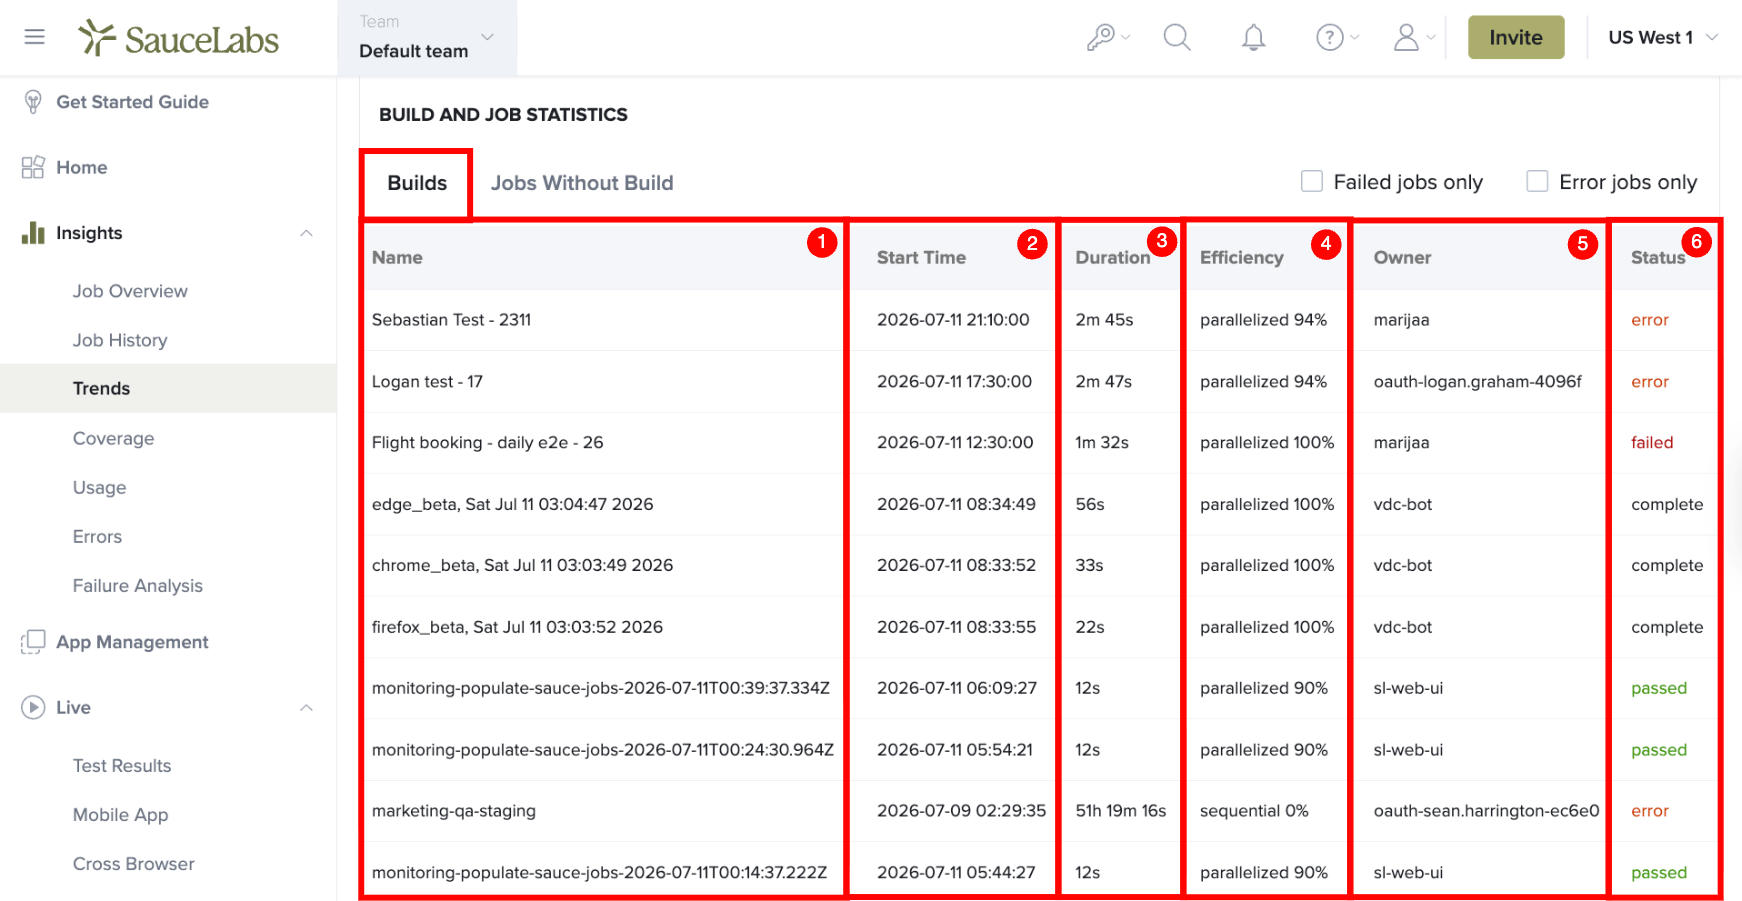
The Builds tab displays test executions that are associated with a Build ID. It provides key execution details for each build, allowing you to review build activity, monitor execution performance, and identify successful or unsuccessful test runs.
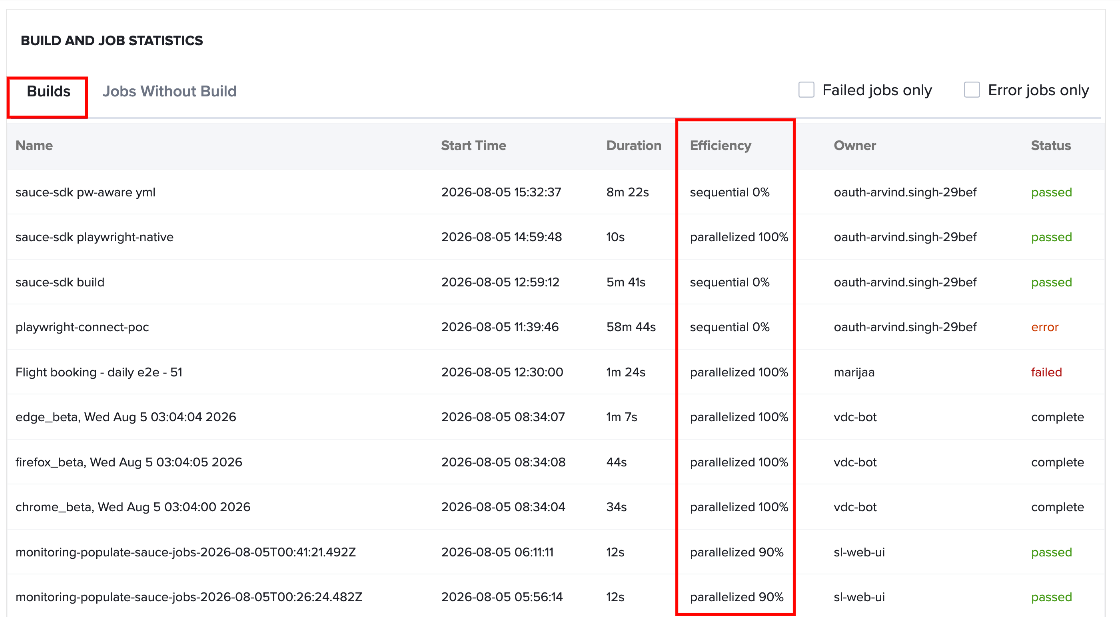
Select the Builds tab to view test executions grouped by Build ID. The Builds table includes the following information:
| Ref. | Column | Description |
|---|---|---|
| 1 | Name | Displays the name of the build. Select the build name to identify and review a specific test execution. |
| 2 | Start Time | Shows the date and time when the build execution started, helping you determine when the tests were run. |
| 3 | Duration | Displays the total time taken for the build to complete, allowing you to compare execution times across different builds. |
| 4 | Efficiency | Indicates how efficiently the tests in the build were executed in parallel. Higher efficiency values generally indicate better parallel execution and shorter overall build times. |
| 5 | Owner | Displays the Sauce Labs user or account that initiated the build, making it easier to identify who ran the tests. |
| 6 | Status | Displays the overall outcome of the build. Common statuses include Passed, Complete, Failed, and Error, allowing you to quickly identify successful and unsuccessful build executions. |
Review Jobs Without Build
The Jobs Without Build tab displays individual test executions that are not associated with a Build ID. It provides execution details for each job, helping you review standalone test runs, identify failures or errors, and investigate individual test executions.
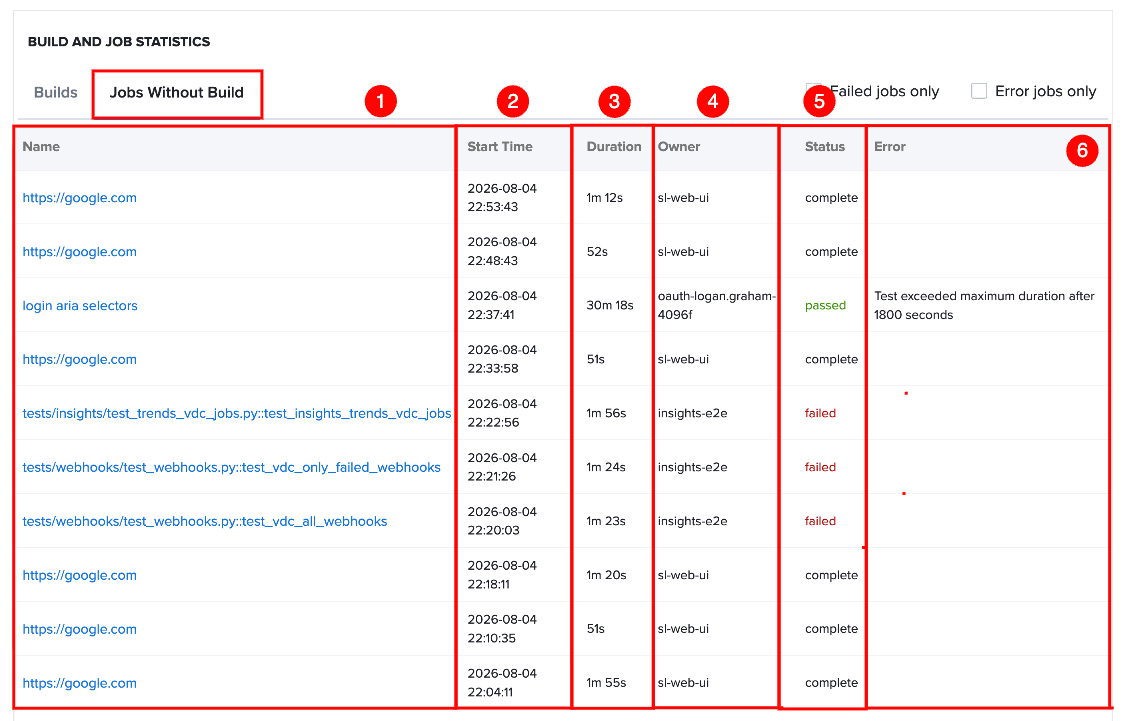
Select the Jobs Without Build tab to view test executions that are not associated with a Build ID. The table includes the following information:
| Ref. | Column | Description |
|---|---|---|
| 1 | Name | Displays the name of the individual test job. Select the job name to identify and review a specific test execution. |
| 2 | Start Time | Shows the date and time when the test job started, helping you determine when the test was executed. |
| 3 | Duration | Displays the total time taken for the test job to complete, allowing you to compare execution times across different jobs. |
| 4 | Owner | Displays the Sauce Labs user or account that initiated the test job, making it easier to identify who ran the test. |
| 5 | Status | Displays the current outcome of the test job, such as Passed, Complete, Failed, or Error, allowing you to quickly identify successful and unsuccessful test executions. |
| 6 | Error | Displays the error message associated with the test job when execution ends with an error. This information helps you quickly identify the reason for the failure and determine whether further investigation is required. |
Filter Results
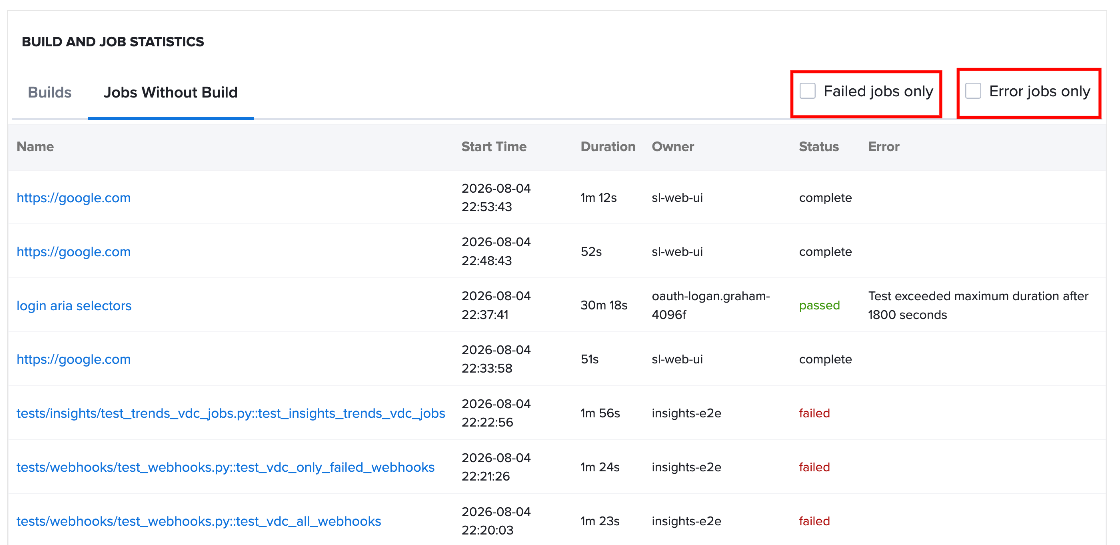
Use the available filter options to focus on specific test executions.
-
Select Failed jobs only to display only failed test executions.
-
Select Error jobs only to display only test executions that ended with an error.
You can also configure additional filters at the top of the Trends page. For more information, see Filter Controls for Trends.
Understand the Efficiency Metric
The Efficiency metric helps you evaluate how effectively the tests in a build are executed in parallel. It compares the total time taken to complete the build with the duration of the longest-running test in that build.
The metric is displayed as a percentage in the Efficiency column of the Builds tab.
A higher efficiency percentage indicates that the tests are utilizing parallel execution more effectively, reducing the overall build execution time. Lower efficiency values indicate that some tests may be running sequentially or that the available parallel resources are not being fully utilized.
Monitoring the Efficiency metric helps you identify opportunities to optimize your test execution strategy, reduce build times, and improve CI/CD pipeline performance.
How the Efficiency Metric Works
The Efficiency metric uses the longest-running test in a build as the benchmark for measuring parallel execution.
If all tests in a build run simultaneously, the total build duration should be approximately equal to the duration of the longest-running test. In this case, the build achieves an Efficiency score close to 100%.
If the total build duration is significantly longer than the longest-running test, it indicates that some tests executed sequentially or experienced delays, resulting in a lower Efficiency score.
The following examples illustrate how the Efficiency metric is calculated.
Example 1: Fully Parallel Build
Consider a build containing the following test executions.
| Test | Run Time |
|---|---|
| T1 | 30 seconds |
| T2 | 60 seconds |
| T3 | 45 seconds |
| T4 | 30 seconds |
In this example, T2 is the longest-running test, taking 60 seconds to complete.
If the entire build also completes in 60 seconds, all tests are executing in parallel. Since the total build duration matches the longest-running test, the build achieves an Efficiency score of 100%.
This represents an ideal level of parallelization because every test is running simultaneously without increasing the total build execution time.
Example 2: Build with Long-Running Tests
Consider another build with the following test executions.
| Test | Run Time |
|---|---|
| T1 | 15 seconds |
| T2 | 20 seconds |
| T3 | 10 seconds |
| T4 | 45 seconds |
| T5 | 30 seconds |
| T6 | 10 seconds |
| T7 | 20 seconds |
| T8 | 15 seconds |
In this example, T4 is the longest-running test at 45 seconds, making it the benchmark for the build.
Even if the build completes in approximately 45 seconds, the overall efficiency may still be limited because several tests finish much earlier than the longest-running test.
Reducing the execution time of long-running tests such as T4 or T5 can improve overall build efficiency and reduce the total execution time for future builds.
Improve Build Efficiency
An Efficiency score of less than 100% means that the entire build took longer to run than the longest test within it, which is an indicator that all the tests in the build are running in parallel. If, on the other hand, the build in our first example ran in 115 seconds compared to the longest test of 60 seconds, its efficiency would be around 52% because the tests are clearly not running in parallel.
The following table provides some guidance for how you might improve your build efficiency based on your score.
| Efficiency | Degree of Parallelization | Recommendation |
|---|---|---|
| 0% | Sequential | The build took as long to run as the sum of each run time of all the tests in it, which means that the tests ran in sequential order. Consider using a test framework to run your tests in parallel. |
| 1–90% | Semi-parallel | The build took less time to run than the sum of all test run times, which means that some tests ran in parallel and some ran in sequential order. Consider reorganizing your tests into small, atomic, and autonomous validations of very focused functionality to make sure they aren't dependent on one another to complete before they can run. |
| 91–100% | Parallel | The build took approximately the same amount of time to run as the longest test in it, meaning that most, if not all, the tests ran simultaneously. You can still potentially improve the overall efficiency of your build by breaking your longer running tests into smaller, shorter tests, if possible. In the benchmarking example for Build A, if T2 could be broken down into two tests that ran for 30 seconds each, you would improve the efficiency of that build by 25%, since the longest running test in it would be 45 seconds instead of 60 seconds. |
See our Short Tests in Parallel blog for a more comprehensive discussion about improving the speed and efficiency of your builds.